Oregon Fatality Assessment and Control Evaluation Program

Promoting safety and conducting surveillance, investigation, and assessment of traumatic occupational fatalities in Oregon.
The Oregon Fatality Assessment and Control Evaluation (OR-FACE) program is a project of the Oregon Institute of Occupational Health Sciences and the Oregon Health Authority. We conduct investigations of fatal occupational incidents to assess risk factors that include the working environment, the worker, activity, tools, energy exchange, and role of management.
OR-FACE is supported by a cooperative agreement with the National Institute for Occupational Safety and Health (NIOSH) through the Occupational Public Health Program of the Public Health Division of the Oregon Health Authority.
OR-FACE resources

Investigation Reports
OR-FACE reports provide detailed information on fatal workplace accidents in Oregon and recommendations for preventing similar occurrences.
Hazard Alerts
OR-FACE's hazard alert documents provide essential information about on-the-job safety issues and recommendations on how to improve workplace safety.

Safety Booklets
OR-FACE publishes safety booklets documenting critical information to help workers across industries and demographics promote safety at work.
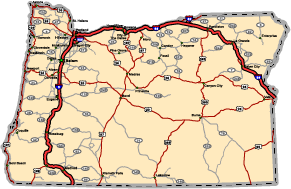
Incident Maps
OR-FACE provides public access to incident maps containing information about fatal workplace accidents in the state of Oregon. Maps are sortable by event, industry, and occupation and contain data from 2003 to the present.
Incident Abstracts
OR-FACE provides public access to a comprehensive list of documented workplace fatalities in the state of Oregon.

Toolbox Talks
OR-FACE produces and provides resources for facilitating Toolbox Talks—informal group discussions focused on safety issues. Our Toolbox Talks resources focus on safety in the construction, transportation, logging, and other industries and are available in English and Spanish.

Research aims
OR-FACE conducts research investigating workplace fatalities and injuries in the state of Oregon to reduce such incidents and promote worker health and safety. Our research aims are to:
- Identify traumatic occupational fatalities through a statewide surveillance network
- Investigate selected traumatic occupational fatalities
- Develop and disseminate prevention strategies for these injuries
- Collaborate with other states and NIOSH to develop strategies to decrease the rate of occupational injuries and fatalities
Explore our annual reports
The Occupational Public Health Program conducts surveillance, investigation and assessment of traumatic occupational fatalities in Oregon, and produces safety materials to promote worker safety. Reports published in the current read contain data from previous years.
Recursos en Español
El equipo de Evaluación y Control de Fatalidades de Oregon (OR-FACE) ha traducido algunas publicaciones al español. Estas publicaciones incluyen los Informes de Investigación, Charlas de Herramientas y Alertas de Peligro de OR-FACE. Obtenga más información sobre cada una de estas publicaciones a continuación.

OR-FACE staff
David Hurtado, Sc.D. – MPI of the Oregon Occupational Public Health Program
Email: hurtadod@ohsu.edu
Jackie Boyd, MPH – Research Project Manager
Email: boydja@ohsu.edu
Rachel Madjlesi, MPH, CIH – Fatality Investigator
Email: madjlesi@ohsu.edu
Contact OR-FACE
Mailing address
OR-FACE Program
Oregon Institute of Occupational Health Sciences
OHSU
3222 SW Research Dr., L606
Portland, Oregon 97239-3098
Phone number
503-494-2281
Email
orface@ohsu.edu
Learn more about our work and provide feedback

Newsletter
Explore professional development opportunities, the latest updates from the Oregon Healthy Workforce Center and the Occupational Public Health Program, a research snapshot, and upcoming occupational health-focused events.

OPHP publications
The Occupational Public Health Program regularly publishes hazard alerts, safety booklets, and other content organizations can use to promote worker health, safety, and well-being in the workplace. Use this form if you'd like to receive our publications.

Give us feedback
We appreciate and look forward to feedback on Occupational Public Health Program and OR-FACE investigative reports and sites. If you'd like to provide us feedback on reports produced by us, please use the form linked below.