For Researchers
Insight into Aging in Place
Data collected from the CART technology platform can paint a more objective picture of how someone lives and ages in their own home. After being funneled through innovative algorithms, data provides insight into a research participant's activity patterns, such as how often someone leaves their home, when someone goes to sleep or how often someone takes their medication. The CART Initiative has several standard visualization and analytic tools that display the data.
Visual data analysis
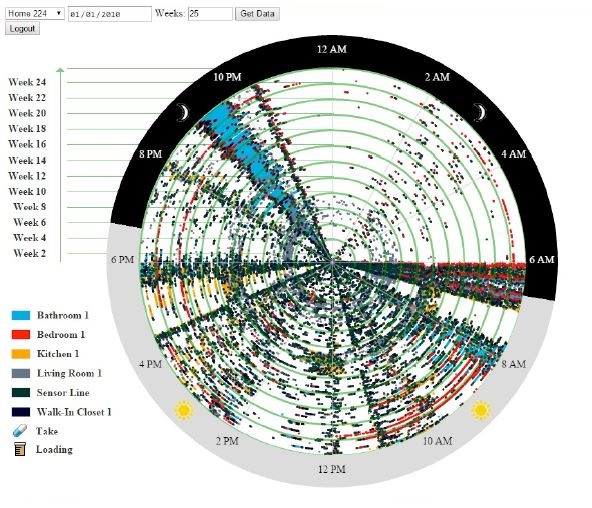
Spiral plots can visually display the relationship of time and activity by location. For example, this spiral plot showcases six months' worth of activity within a home. Each day is represented by one circle. The colors represent sensor firings in a particular room of the house, in turn displaying which rooms a participant walked into during a particular day.
Setting up a new research site
CART plans on expanding its network of homes in several years. Researchers will review the data compiled during the first-phase Demonstration Project. Using data about aging in place and about the efficacy of the technology platform, the Initiative will recommend when the expansion should begin and how many more homes should be included. The overall goal is to expand the network to several thousand. During this expansion phase (Phase II), CART will further facilitate the health and well-being of older adults, with the goal of reducing hospitalizations and nursing home admissions.
Interested in helping CART expand its research network or interested in developing a new research site? Contact sharmani@ohsu.edu.