National Core Indicators
The National Core Indicators® – Intellectual and Developmental Disabilities (NCI-IDD) program is how state developmental disability agencies find out how well they are doing. The state asks people with disabilities and their families what they think about the services they receive. This helps make services better. The program is run by two groups: the National Association of State Directors of Developmental Disabilities Services (NASDDDS) and the Human Services Research Institute (HSRI). In 2020-21, 48 states and the District of Columbia took part in NCI-IDD. Some states do not do the survey every year. Oregon Office of Developmental Disabilities Services (ODDS) has hired us to survey in Oregon.
What is data used for?
Information collected drives service improvement by helping to:
- Identify gaps in service
- Highlight successes
- Compare to other states
- Track system performance over time
- Give direct input from advocates and families
How do I get involved?
Interview participants are randomly selected by the state of Oregon and invited to take part in the survey. If you or a care provider is contacted about the survey, it is a good opportunity to provide your input on how well developmental disability services are working in our communities.
Please share our data briefs and about the importance of quality developmental disability services with others.
Who supports NCI?
The Oregon Office of Developmental Disabilities Services contracts the University Center for Excellence in Developmental Disabilities at OHSU to collect data for the In-Person Survey and Child Family Survey for the state of Oregon.
On a national scale, 48 other states, the District of Columbia, and 21 sub-state entities participate in NCI. The project is supported by the Human Services Research Institute and the National Association of State Directors of Developmental Disabilities Services.
Who to contact
Yelena Voznyuk, M.S. - Data Projects Manager
and
Rhonda Eppelsheimer, M.S.W., L.C.S.W. - Principal Investigator
Email ucedd@ohsu.edu
More about the survey process
Meet the 2026 Interviewers

Anne Niven, M.Div.
Anne Newkirk Niven, M.Div. (she/her pronouns), is a research assistant and interviewer for the UCEDD. Niven works on the National Core Indicators project, and the RRTC Prevalence study.

Corey C.
Corey (he/him pronouns) is a research assistant for the UCEDD. Corey has worked on various projects including the National Core Indicators project.

Jennifer Kotzin, B.S., B.A.
Jennifer Kotzin, B.S., B.A. (she/her pronouns), is a research assistant at the UCEDD. Kotzin has worked on various projects including the National Core Indicators project.

Julie Munson, M.S.W.
Julie Munson, M.S.W. (she/her pronouns), is a community research liaison at the UCEDD. She works on the National Core Indicators project as a Survey Interviewer.

Liv Campa
Liv Campa (she/they pronouns) is an M.S.W. candidate and the Health Administration trainee for 2025-2026 LEND. They are a survey interviewer for the National Core Indicators project.
Pam Vergun, M.P.A.
Pam Vergun, M.P.A. (she/her pronouns), is a surveyor for the UCEDD. She works on the National Core Indicators project doing interviews, entering surveys sent in by family members of children who receive services, and helping with other tasks as needed.
Surveys we use in Oregon
-
Summary
Intellectual and Developmental Disabilities (NCI-IDD) program is a voluntary effort by state developmental disability agencies to track their performance using a standardized set of consumer and family/guardian surveys with nationally validated measures. The effort is coordinated by the National Association of State Directors of Developmental Disabilities Services (NASDDDS) and the Human Services Research Institute (HSRI). In 2020-21 a total of 48 states, the District of Columbia and 22 sub-state entities participated in NCI-IDD. Not all participating states do all surveys every year.
Method
Interview participants are randomly selected by the state of Oregon and invited to take part in the survey. If you or a care provider is contacted about the survey, it is a good opportunity to provide your input on how well developmental disability services are working in our communities.
Highlights
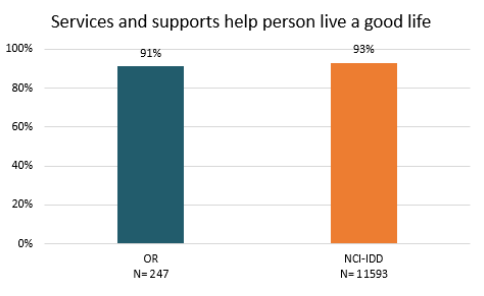
- Satisfaction with services: Oregon only has a 91% satisfaction rating with their Services compared to the national average of 93%.
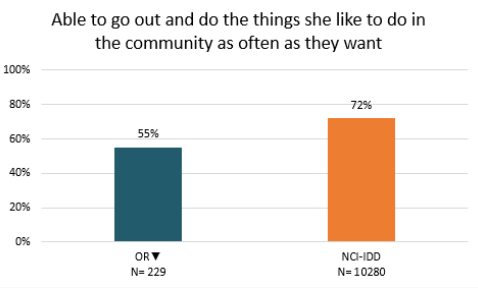
- Community Outings: Only 55% of people in Oregon go out into the community as often as they want to while the national average is 72% of people.
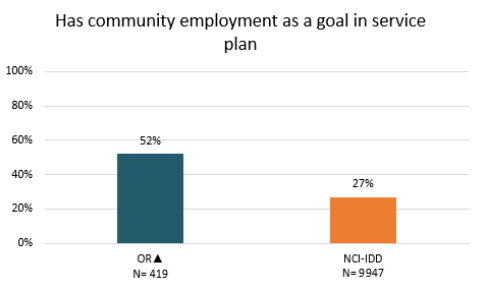
- Community Employment: 52% of people in Oregon said they have community employment as a goal in their service plan, and the national average is 27%.
Recent reports
-
Summary
The NCI-IDD Child Family Survey is used to gather data on family outcomes. It is mailed to families who have a child who lives with the respondent and receives at least one service in addition to case management from the state DD agency. The survey collects demographic information on both the child receiving services (‘child’) as well as the person who fills out the survey (the ‘respondent’) and information on services and supports received. The survey is continually refined and tested to ensure it is valid and reliable.
Method
OHSU assists ODDS with mailing out surveys to participants. Some of the people who participate fill out the survey directly online and others will fill in a paper copy and mail the survey back in for OHSU staff to enter in the online record.
Highlights
Table 5a. Child's Health Conditions
All data are reported by the respondent based on their understanding of their child's demographics, diagnoses and personal characteristics. Categories are not mutually exclusive, therefore N is not shown.
State Cardiovascular Disease Diabetes Cancer High Blood Pressure High Cholesterol Oregon 7% 3% 3% 4% 8% Weighted NCI-IDD Average 13% 4% 2% 6% 5% Dental Care Access
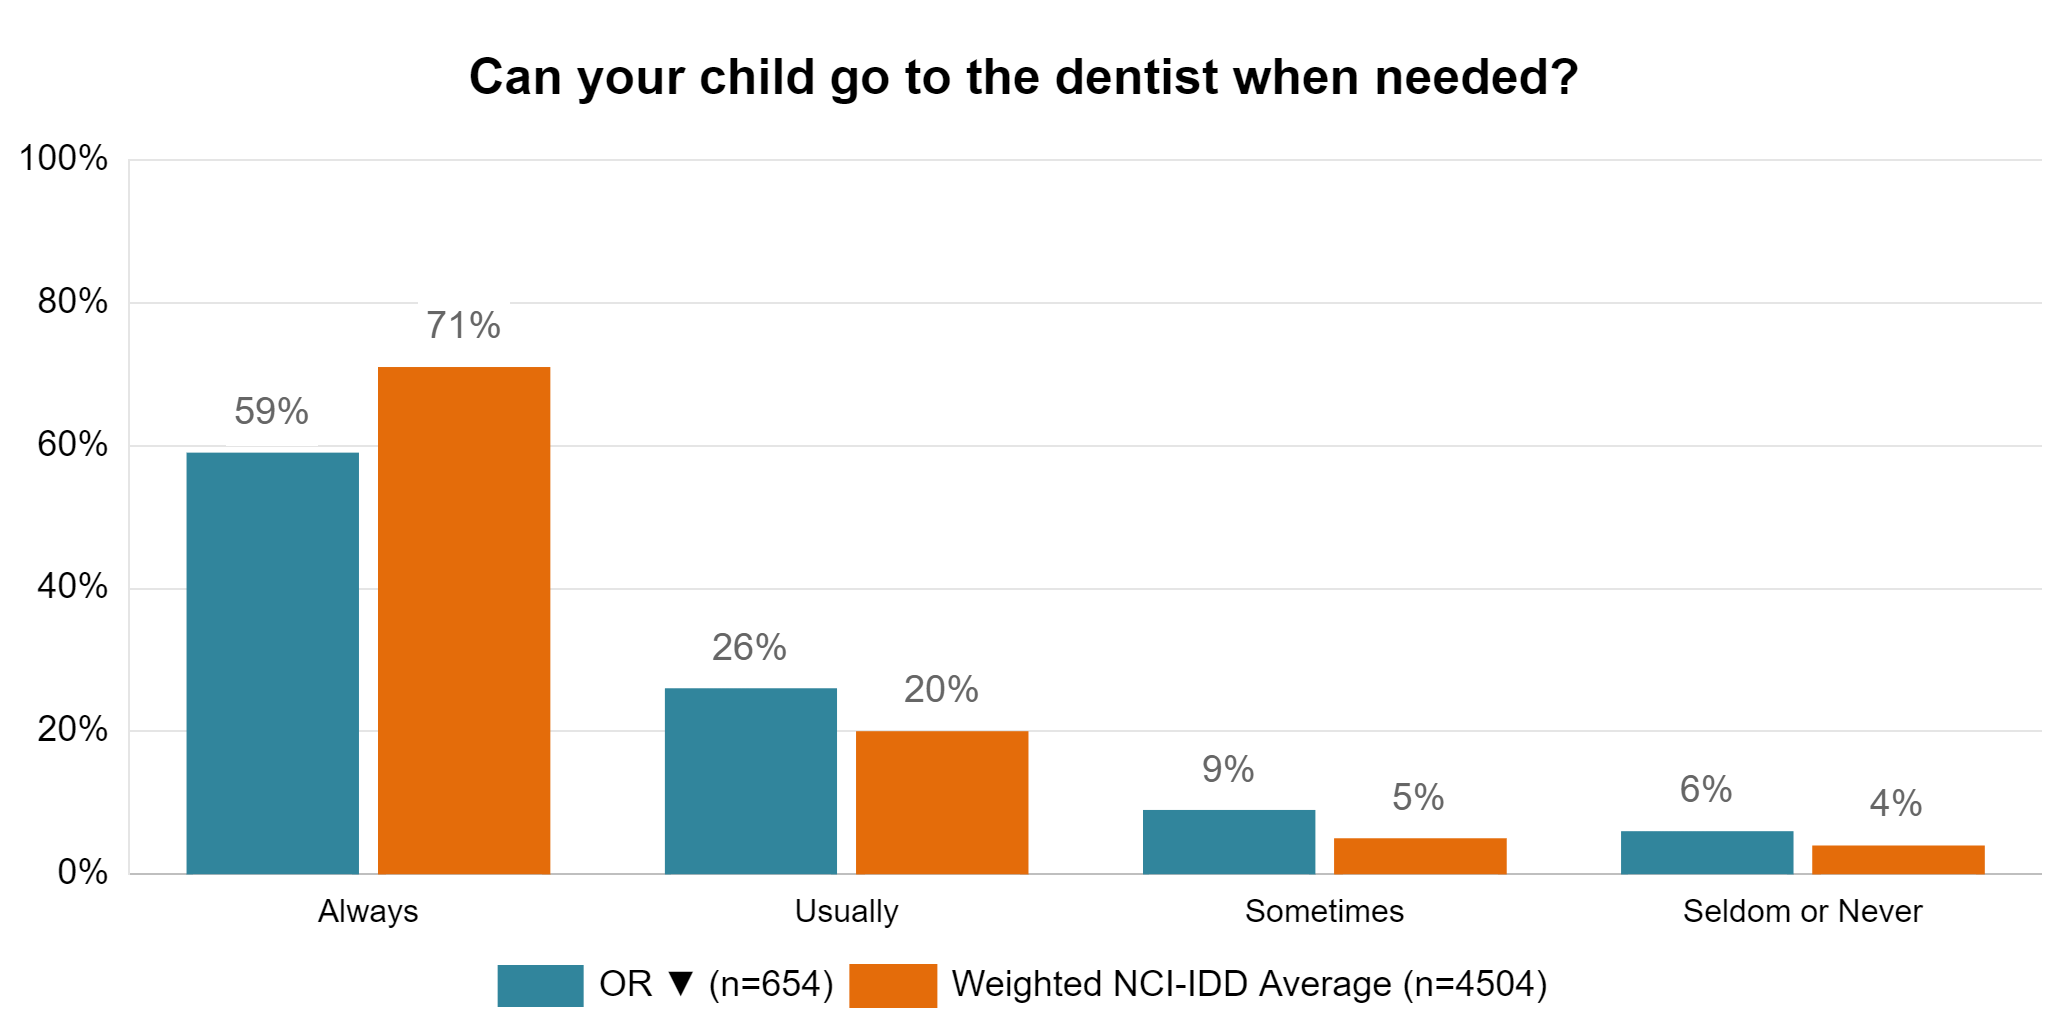
Data from the Child Family Survey (CFS) 2020-21 State Report Oregon (OR) Report Bar Chart: Can your child go to the dentist when needed? Always: 59% of people in Oregon responded "Always", while the Weighted NCI-IDD Average was 71%. Usually: 26% of people in Oregon responded "Usually", while the Weighted NCI-IDD Average was 20%. Sometimes: 9% of people in Oregon responded "Sometimes", while the Weighted NCI-IDD Average was 5%. Seldom or Never: 6% of people in Oregon responded "Seldom or Never", while the Weighted NCI-IDD Average was 4%. Oregon n=654; Weighted NCI-IDD Average n=4504.
Satisfaction with Services and Supports
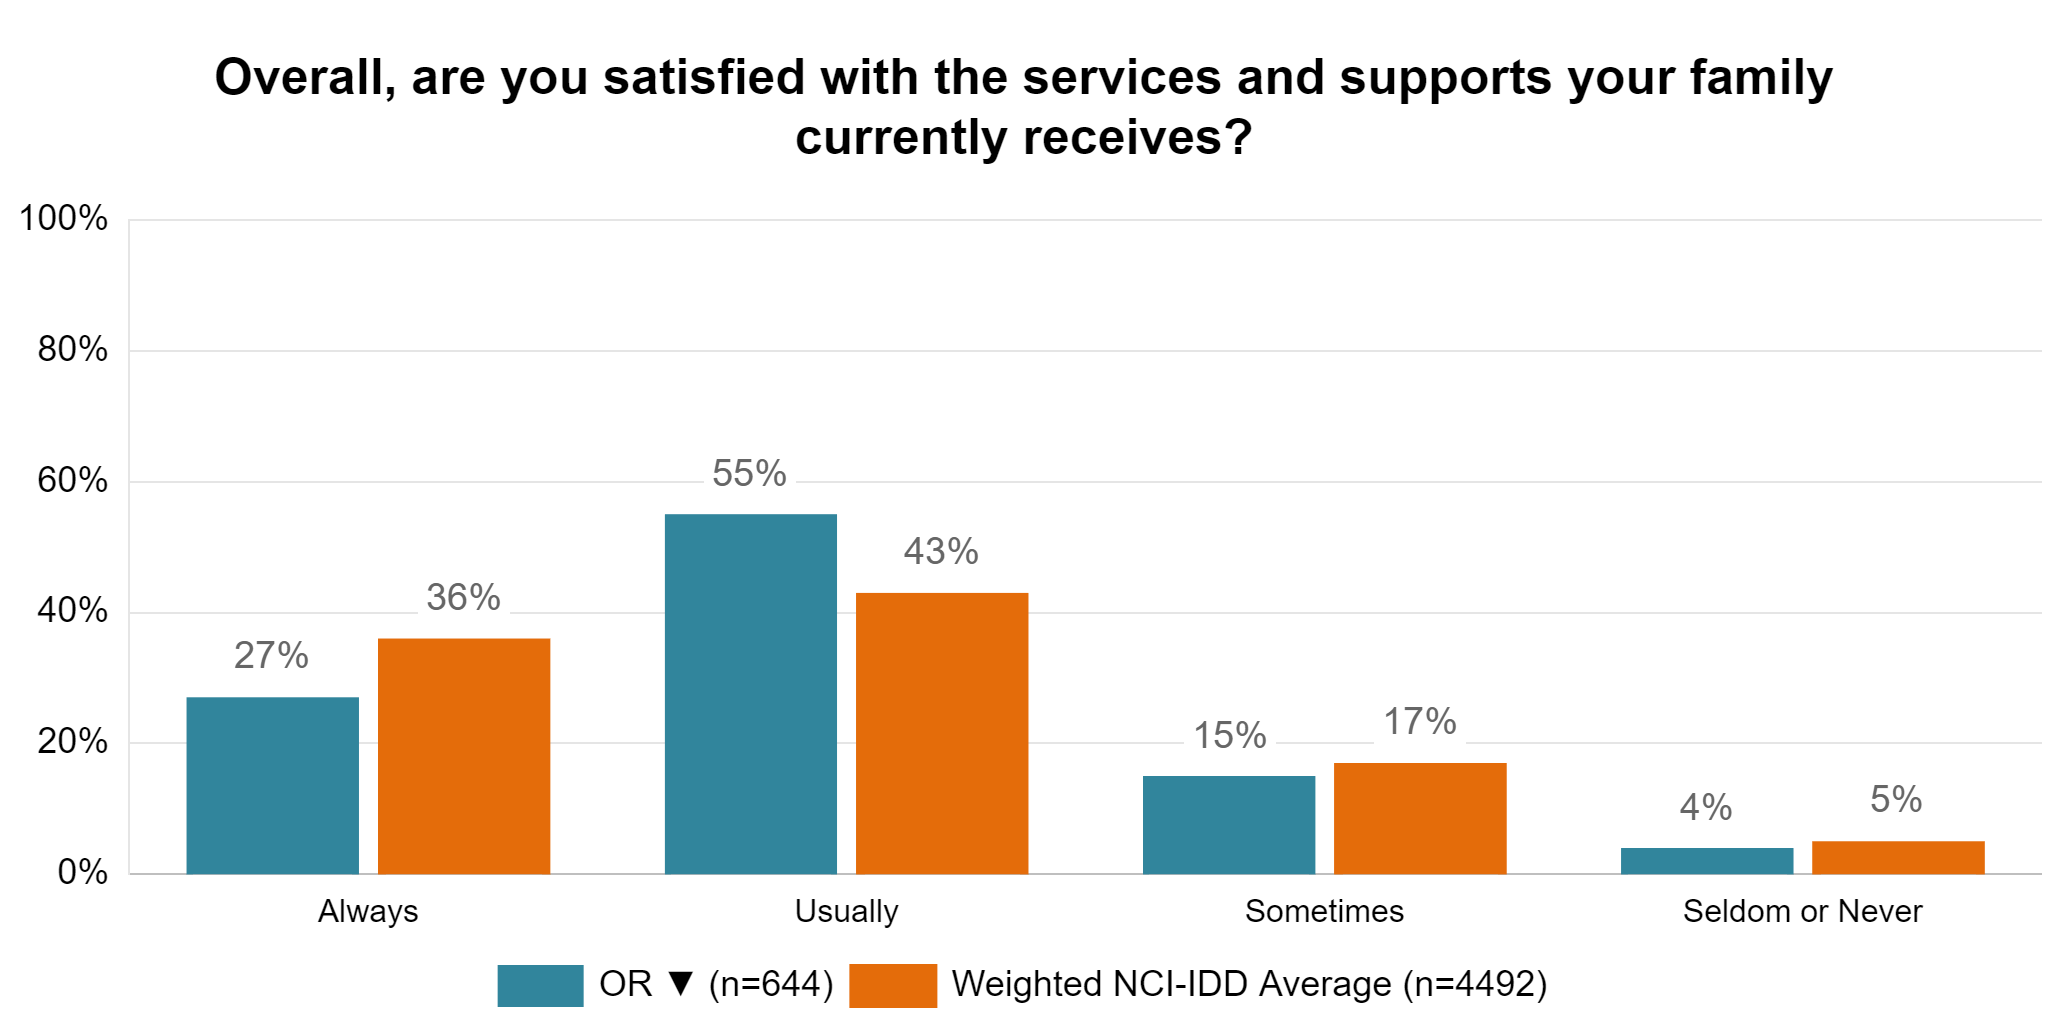
Data from the Child Family Survey (CFS) 2020-21 State Report Oregon (OR) Report Bar Chart: Overall, are you satisfied with the services and supports your family currently receives? Always: 27% of people in Oregon responded "Always", while the Weighted NCI-IDD Average was 36%. Usually: 55% of people in Oregon responded "Usually", while the Weighted NCI-IDD Average was 43%. Sometimes: 15% of people in Oregon responded "Sometimes", while the Weighted NCI-IDD Average was 17%. Seldom or Never: 4% of people in Oregon responded "Seldom or Never", while the Weighted NCI-IDD Average was 5%. Oregon n=644; Weighted NCI-IDD Average n=4492.
-
Summary
The annual NCI-IDD State of the Workforce Survey gets information on the Direct Support Professional (DSP) workforce providing direct supports to adults (age 18 and over) with intellectual and developmental disabilities (IDD). The goal of the survey and the results help states learn about workforce challenges, find areas for further investigation, benchmark their workforce data, measure improvements made through policy or programmatic changes, and compare their state data to those of other states and the NCI-IDD average. The UCEDD works with the Oregon Office of Developmental Disabilities Services to look at NCI-IDD State of the Workforce Survey data.
Recent reports
- 2025 Staff Stability Report - Oregon
- 2024 Staff Stability Report - Oregon
- 2023 Staff Stability Report - Oregon | Español
- 2022 Staff Stability Report - Oregon | Español
- 2020 Staff Stability Report - Oregon
For more languages, see reports on the ODHS website.
For surveyors
The video "Conducting the NCI Survey With People Who Use Augmentative and Alternative Communication (AAC)" introduces NCI trainees to AAC and provides strategies and tips for communication.
Related research
Learn about how differences in health, access to health care, and quality of care affects people with disabilities on our Health disparities in the adult IDD population in Oregon data dashboard.