100% match rate
All students who applied for residency in 2026 matched. Explore our program effectiveness.
Scholarships available
OHSU offers scholarships to help fund your degree.
Contact us
- Email mpadmissions@ohsu.edu
- Call 503-494-7461
Why choose OHSU for your Medical Physics degree?
The OHSU Medical Physics Graduate Program combines rigorous coursework and hands-on clinical training with personalized faculty mentorship and academic support. You’ll graduate prepared to make a meaningful impact on patient care in medical physics.
- High residency placement. Every student who applied for residency in 2026 matched.
- CAMPEP-accredited. Earn your degree from a program that meets national standards. Our graduates are eligible for clinical residencies and board certification paths.
- Expert faculty. Learn from leaders who mentor you through impactful research and clinical training.
- Specialize in your area of interest. Focus on radiation therapy physics or diagnostic imaging physics with additional opportunities in theranostics.
New to medical physics?
Discover what medical physicists do, where they work and how to build a career in this field.
Explore medical physics programs
M.S. in Medical Physics
Earn your master’s degree in medical physics and apply your skills to advance the diagnosis and treatment of disease.
Ph.D. in Medical Physics
Earn your Ph.D. in medical physics and deepen your expertise through advanced research and mentorship.
Program effectiveness
Graduates of OHSU's medical physics programs go on to rewarding careers in hospitals, clinics, research and industry. Many have taken roles in clinical practice, consulting, academia and industry. Nearly 90% of students who applied for residencies over the last five years secured one.
-
Admissions statistics
Application cycle Applicants Offered admission Matriculated Total enrolled Left prior to graduation (other program, residency, etc.) 2012-13 79 26 4 9 1 2013-14 75 15 5 13 2014-15 50 11 3 11 2015-16 50 25 4 11 1 2016-17 32 20 4 12 2017-18 36 30 7 12 1 2018-19 49 26 6 6 1 2019-20 51 24 8 14 2020-21 45 18 6 13 1 2021-22 25 13 6 10 1 2022-23 21 13 5 10 2023-24 31 19 6 11 2024-25 31 15 7 14 -
Placement statistics
Graduation year Graduated Residencies Industry Clinical positions Academic positions Continued on to Ph.D. Other activities 2013 2 1 2014 2 2 2015 4 1 3 2016 3 1 3 2017 5 3 1 1 2018 3 2 1 2019 6 4 1 1 2020 6 3 2 1 2021 8 4 1 3 2022 5 1 1 1 2 2023 5 4 1 2024 5 2 1 2 2025 6 5 1
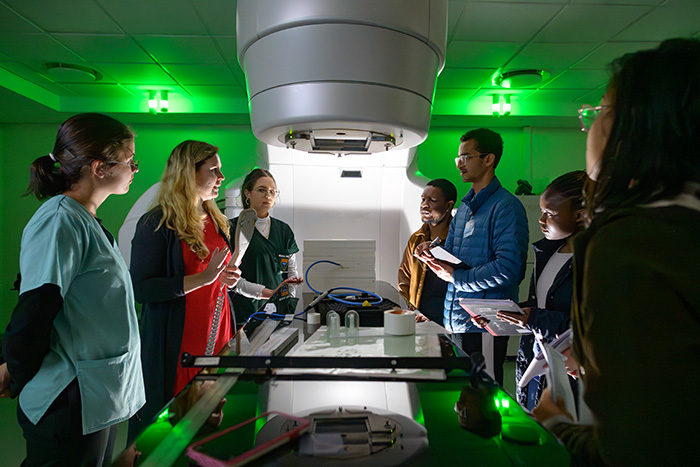
State-of-the-art facilities
Train on advanced imaging and radiation therapy equipment across OHSU’s campuses. Equipment includes a PET/MRI scanner, a brand-new LINAC and several high-field MRI scanners. You’ll gain hands-on experience in a real clinical environment, with unique opportunities to work in theranostics, a cutting-edge field that combines therapy and diagnostics.
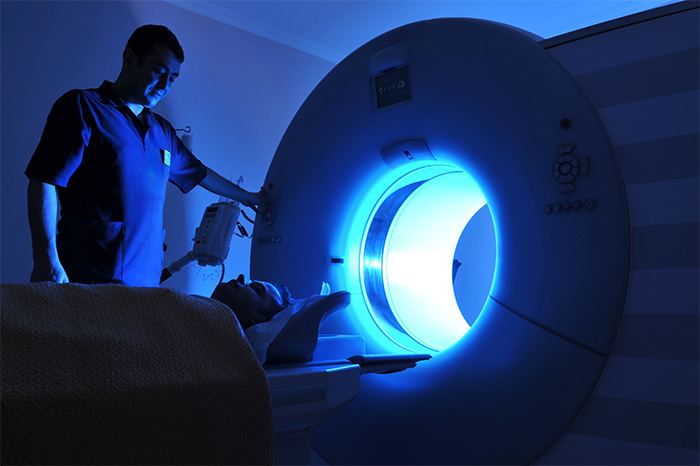
Diagnostic imaging facilities
The Department of Diagnostic Radiology at OHSU operates imaging facilities at the Marquam Hill campus hospital, the Center for Health and Healing and seven satellite facilities.
-
Diagnostic imaging equipment
- 14 general radiographic rooms (all digital radiography)
- 12 with wireless digital radiography
- 6 radiographic and fluoroscopic rooms
- 6 interventional suites
- Including 2 biplane rooms and 5 with flat-panel detectors
- 4 cardiac catheterization angiography suites
- 24 portable X-ray units
- Including 5 with wireless digital radiography detectors
- 24 portable fluoroscopic units
- Including 4 with flat-panel detectors
- 8 diagnostic CT scanners (16-320 slice)
- 5 with iterative reconstruction technology
- 2 with iterative model-based technology
- The fleet includes a Toshiba Aquilion ONE Prime 320-slice CT and a Philips Brilliance iCT 256-slice scanner
- 2 mobile head CT scanners
- 6 MRI scanners
- Two 3.0 Tesla magnets, three 1.5 Tesla magnets and one open magnet
- 22 diagnostic ultrasound units
- 3 full-field digital mammography units
- One digital breast tomosynthesis unit and one additional stereotactic breast biopsy unit
- 1 PET/MRI
- 2 PET/CT units
- One with time-of-flight technology
- 1 SPECT/CT unit
- 2 gamma cameras with flat-panel cone-beam CT
- 2 C-arm interventional radiology units used for animal research at the Dotter Research Institute
- C-arm fluoroscopy and mobile CT used for animal research at the Oregon National Primate Research Center
- 14 general radiographic rooms (all digital radiography)
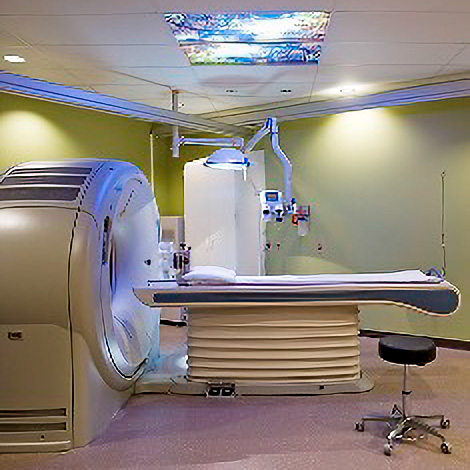
Radiation therapy equipment
The Department of Radiation Medicine at OHSU operates oncology treatment facilities at the Marquam Hill campus and two satellite facilities.
-
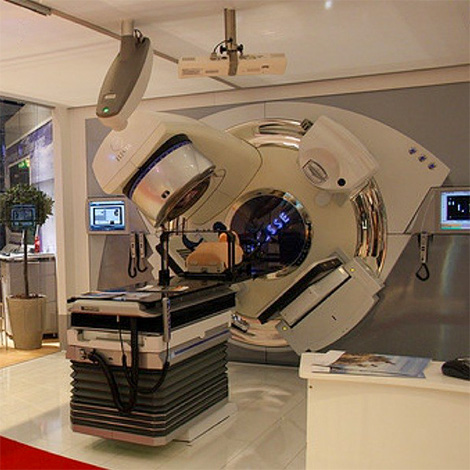
Radiation therapy equipment
Linear accelerators:
- 2 Elekta Versa HD
- Elekta Infinity
- Elekta Infinity (satellite campus)
- Mobetron IORT linear accelerator
- Intrabeam IORT
- TomoTherapy
Imaging, localization, treatment planning and record-and-verify systems:
- Cone-beam CT
- Novalis (SRS) with Big Bore CT
- Novalis robotic tabletop (Varian)
- ExacTrac (BrainLab)
- Calypso prostate localization
- Respiratory gating
- VisionRT laser scanning patient positioning system
- Eclipse treatment planning system with RapidArc license
- Pinnacle treatment planning system with SmartArc license
- Monaco (CMS) with VMAT license
- iPlan treatment planning system (BrainLab)
- IMPAC record and verify (Mosaiq RBV)
Treatment types include:
- IMRT, conventional, 3D conformal radiation therapy, external beam therapy
- SRS, SBRT
- Total body irradiation
- Total skin electron therapy
- Novalis/ExacTrac
- Eye plaquesLDR seed implants (permanent and temporary)
- HDR
- TomoTherapy
- IORT (Mobetron, Intrabeam)
Advanced Imaging Research Center
Train on high-field MRI scanners in a dedicated research environment in OHSU’s Advanced Imaging Research Center (AIRC).
Schedule a visit
Schedule an in-person or virtual visit to learn more. Email us at mpadmissions@ohsu.edu.

Living in Portland and Oregon
Virtual tour
Student support
Discover how OHSU supports students with academic resources, health and wellness services, housing support and more.
Explore student support services.
Life at OHSU
About the program
OHSU's Medical Physics Graduate Program launched in 2006 as a joint degree with Oregon State University, originally called the Oregon Medical Physics Program. The partnership brought together local experts in radiation physics and medicine.
The program evolved to meet students' needs:
- 2014: We added a diagnostic imaging physics track alongside the radiation therapy physics track.
- 2016: Students began enrolling directly at OHSU to increase clinical experience.
- 2021: The program became fully OHSU-based to offer more integrated clinical and research experiences.
Accreditation
OHSU’s Medical Physics Graduate Program is accredited by CAMPEP through 2030.
-
Program objectives
Faculty and program leadership design and deliver the curriculum to meet the following objectives:
- Demonstrate consistent practices that reinforce safety, continual learning, collegiality and ethical behavior.
- Teach the theoretical foundations of clinical medical physics so students can make accurate judgments when confronting clinical problems.
- Support communication skills development in interprofessional settings so graduates are prepared for residency and future careers in medical physics.
- Expose students to a wide array of educational references, research areas and clinical situations, allowing them to choose the area of medical physics that suits their interests and abilities.
- Teach methods of evaluating medical physics research and critique students' didactic, research and clinical work to establish truthful self-assessment.
- Encourage innovative and clinically translatable research, providing students with guidance and tools to solve problems and create new knowledge in medical physics.
- Integrate an ethical framework within education and clinical practice that makes teamwork, self-awareness and patient safety inextricable components of medical physics practice.
-
Student learning outcomes
By the end of their program, graduates will be able to:
- Explain the components, functionality and design of x-ray systems utilized in imaging and therapeutic devices found in Radiation Medicine or Diagnostic Radiology.
- Explain the components, functionality and design of a linear accelerator utilized for external beam radiation therapy treatment in Radiation Medicine.
- Communicate the risks associated with the use of radiation to members of the public, patients, and professionals in health care.
- Apply radiation safety principles in the calculation and design of radiation shielding. This will include communicating with a team of individuals from equipment manufacturers, design and construction, architects, hospital administration and clinicians.
- Take Part 1 of the American Board of Radiology Initial Certification Exam.
- Execute a research project based on in-depth knowledge of scientific literature, experimental design and statistical tools.
- Explain the biological and chemical pathway for radiation-induced carcinogenesis, including time intervals and all potential outcomes.
- Transfer knowledge through the formal education process.