Projects
How leukemia evades the immune system
Immune therapies, such as chimeric antigen receptor T cells, bispecific antibodies, and immune checkpoint inhibitors, have emerged as promising modalities in multiple hematologic malignancies. Despite the excitement surrounding these therapies, we are currently unable to predict which patients will respond, and which patients are at the highest risk for the unique toxicities associated with these therapies. Within solid tumors, the status of the immune microenvironment provides valuable insight regarding potential responses to immune therapies. Much less is known about the immune microenvironment within hematologic malignancies, but the characteristics of this environment are likely to serve a similar predictive role.
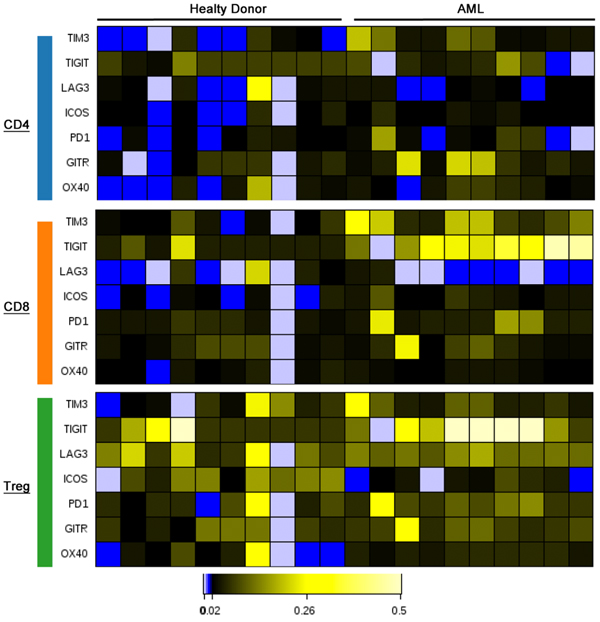
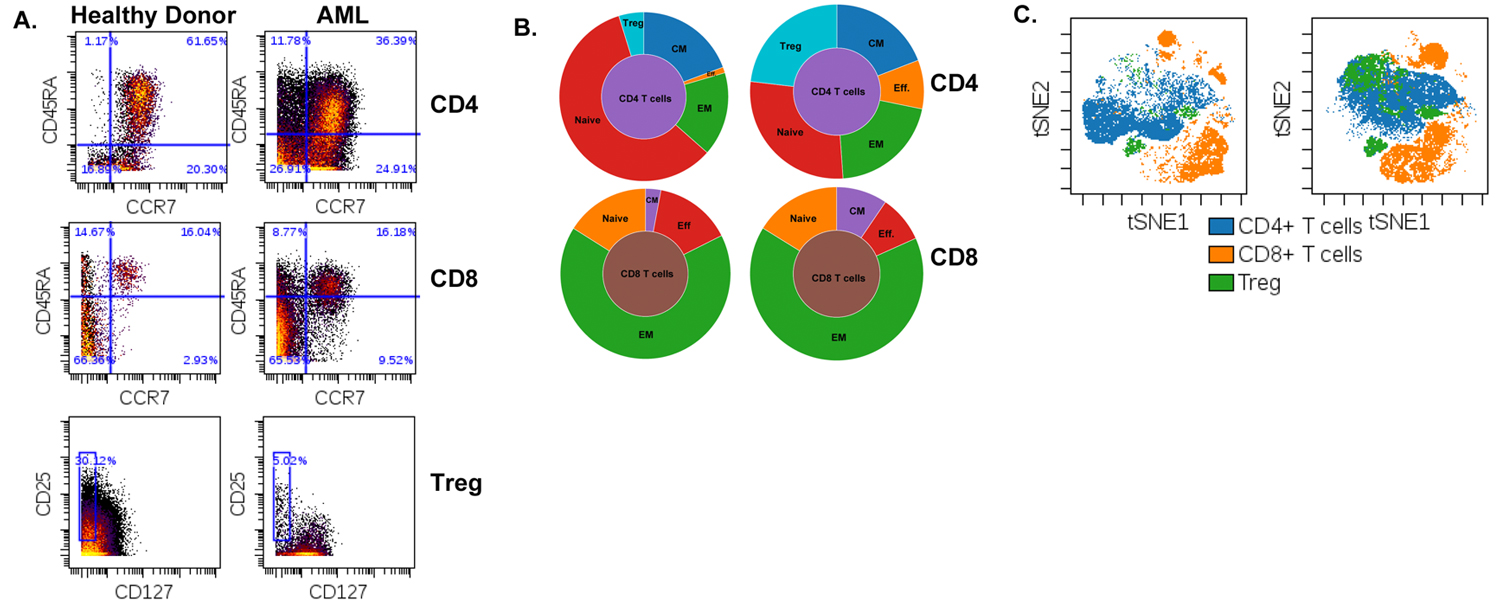
Acutemyeloid leukemia (AML) is the most common hematologic malignancy in adults, and only 25% of patients are alive at 5 years. Our lab uses both patient samples and mouse models of AML to study the effect of AML on the immune system. Of particular interest to our lab is to study the mechanism of action of combined targeted drug and immune therapies on hematological malignancies with a focus on AML. We make extensive use of mass-spec based flow cytometry (aka CyTOF) to develop a “road map” of the cell types and functional status of cells in the bone marrow and blood of leukemia patients.
Micro-RNA (miRNA) in adaptive and innate immune responses
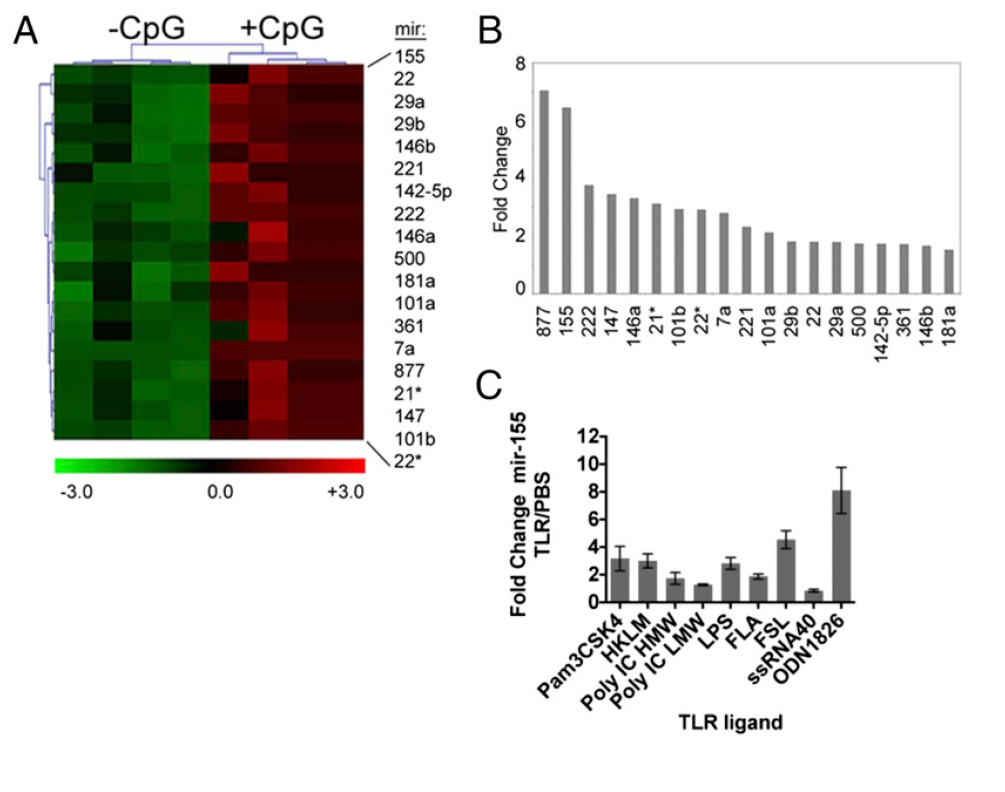
The discovery of miRNAs has revolutionized our understanding of protein regulation. The study of how these molecules regulate immune responses has recently become a field of intense interest. Our lab studies how miRNAs modulate both innate and adaptive immune responses. We are specifically testing the impact of specific miRNAs on the ability of DCs to promote protective T cell responses using a variety of bacterial and viral pathogens. Better understanding of how DCs prime T cell responses will allow us to develop more efficient DC-based cancer vaccine strategies in the future.
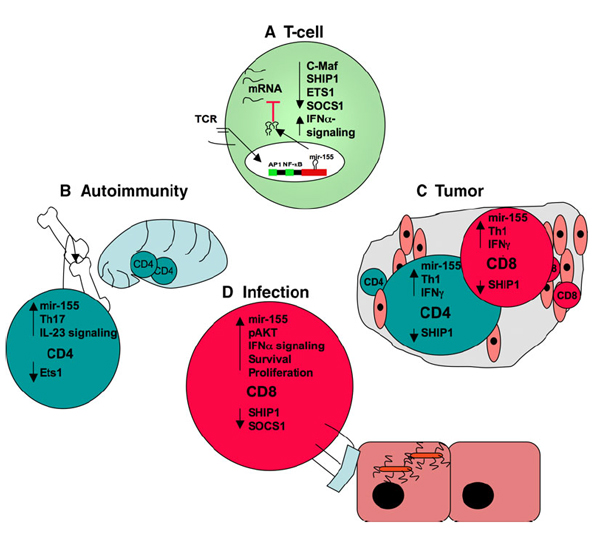
Figure on right: The effects of mir-155 on T cells in the context of autoimmunity, antitumor responses, and infection. (A) T-cell receptor engagement results in increased mir-155 levels in the T cell. The resulting translational repression of target mRNA molecules, several of which with identified T-cell function (listed), leads to increased functional activity of the T cell. (B) In the context of autoimmunity, mir-155 has an impact on skewing to the Th-17 lineage though the regulation of ETS1 expression and IL-23 signaling. (C) Antitumor T-cell responses require mir-155 to allow vigorous cellular expansion and IFN-γ production. (D) CD8+ T cells require mir-155 to promote clonal expansion, survival and memory generation as part of their antiviral and antibacterial responses.