Endothelial Cells
Cardiovascular disease remains the leading cause of death globally and endothelial cells drive multiple acute and chronic cardiovascular events. Because of this, it is paramount to understand the effects of various insults on endothelial cells and to identify targets that will decrease the risk of cardiovascular disease. Endothelial cells are critical mediators to the transfer of biological cells and signals from the blood to the surrounding tissues.
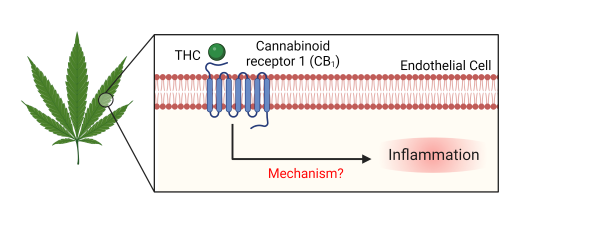
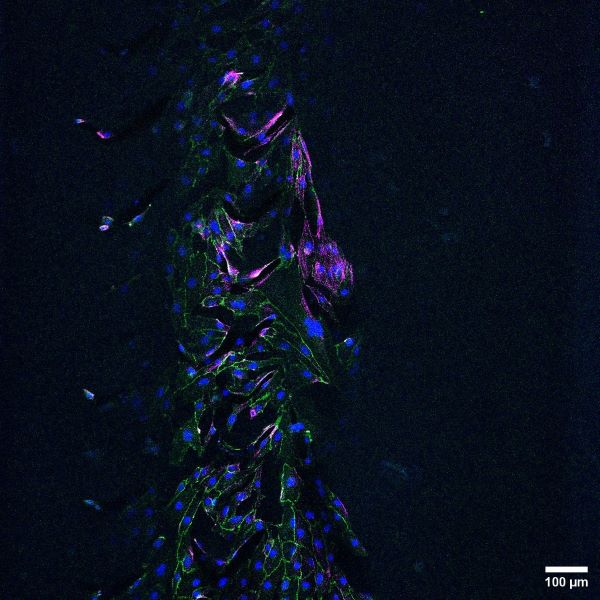
Following ingestion of food or drugs, metabolites will circulate in the blood, thus will bind to receptors on endothelial cells. Our lab has a particular interest in how delta-9-tetrahydrocannabinol (THC), the psychoactive component of cannabis, affects endothelial cells. Our study of maternal THC consumption resulted in alterations to inflammatory genes in fetal vasculature. These finding motivated our in vitro studies to elucidate the role of cannabinoid receptor 1 (CB1) in endothelial inflammation. Our mechanistic approach utilizes cell culture of primary endothelial cells to assess phenotypic and subsequent functional changes from various CB1 agonists, including THC. Understanding endothelial cells’ biological response to external stimuli will help contribute to patient treatment and prevention of cardiovascular disease.
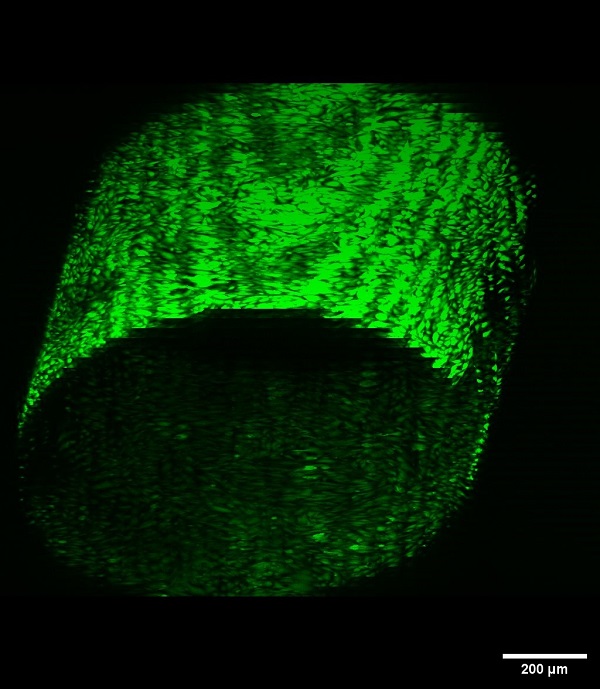
Vascular disease models made from hydrogels can be used to study basic endothelial cell biology in a healthy and diseased states. These models are three-dimensional and with higher dimensionality, comes superior biological relevance. In collaboration with the Schutt Ibsen Energy Responsive Biomaterials Lab at OHSU, the Hinds lab is working to construct a 3D vascularized tissue model to investigate the effects of biomaterial properties on endothelial cells.
3D vascular tissue models can be used to study how hydrogel mechanical properties, such as stiffness and compliance, affect endothelial cell health. This information can be used to inform the development of physiologically-relevant hydrogels for either in vitro vascular disease models or bioengineered vasculature for organ generation.
Current work focuses on the development of a vascular channel lined with endothelial cells that supports long-term cell health and angiogenic outgrowth. Future goals include the addition of breast cancer spheroids in the model to replicate breast cancer-vascular endothelial cell crosstalk (disease model).