Data & Reporting
Graduate Studies Doctoral & Master's Degree Statistics
Click the headings below to view summary degree-level statistics about PhD and Master's admissions, enrollment demographics, degree completion, and career outcomes (PhD only). For tabular versions of any of these reports, please email somgrad@ohsu.edu .
If there is a specific report that you would like to see (e.g., demographics data for a specific program or admissions reports for specific demographics), please contact our office (somgrad@ohsu.edu). Our Data Analyst, Keith Birchfield, may be able to accommodate special requests. Requested reports and data can be made available via OneDrive.
Please note that some of the data that we collect are protected by FERPA, such as race, gender, citizenship status, grades, and funding in some circumstances. In order for us to share these data and reports, we will need to work with you to maintain FERPA compliance. Please contact us for more information.
Doctoral Statistics
PhD Admissions Summary
Includes all applicant pools from AY 2017-18 through AY 2023-24 organized by year of intended entry. MD/PhD program applications are excluded. Data through Fall 2023.
Admit Rate is calculated as the number of admits divided by the number of applications.
Yield Rate is calculated as the number of matriculations divided by the number of admits.
PhD Enrollment Demographics
Student enrollment is calculated for fall terms and displayed by fall term calendar year from 2017 through 2023. Students on leave or withdrawn for the term are not counted.
US Resident: US citizens or permanent residents
US Non-Resident: Not a US citizen or permanent resident
Under-Represented Group (URG): Students who are US citizens or permanent residents who identify as African American/Black, American Indian/Alaska Native, Hispanic/Latino, or Native Hawaiian/Pacific Islander, or who are multiracial and identify in at least one of the preceding race and ethnic categories.
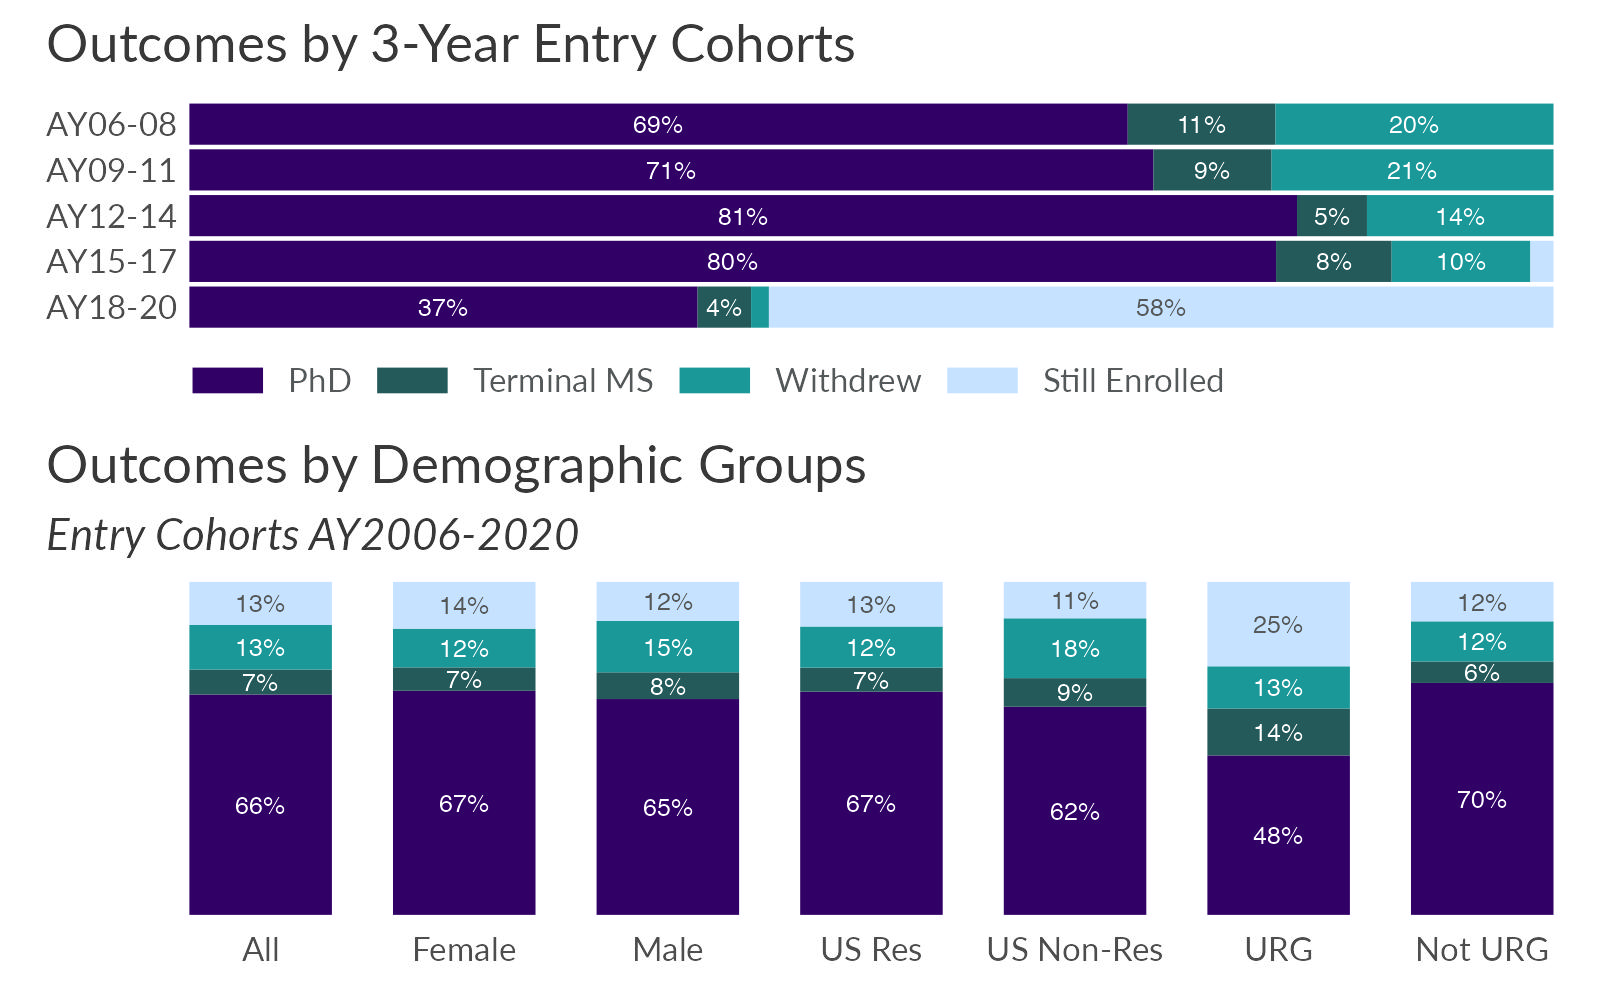
PhD Degree Completion
Completion outcomes are organized by academic years of entry based on the student's primary degree program upon matriculation.
See Enrollment section for descriptions of demographic categories.
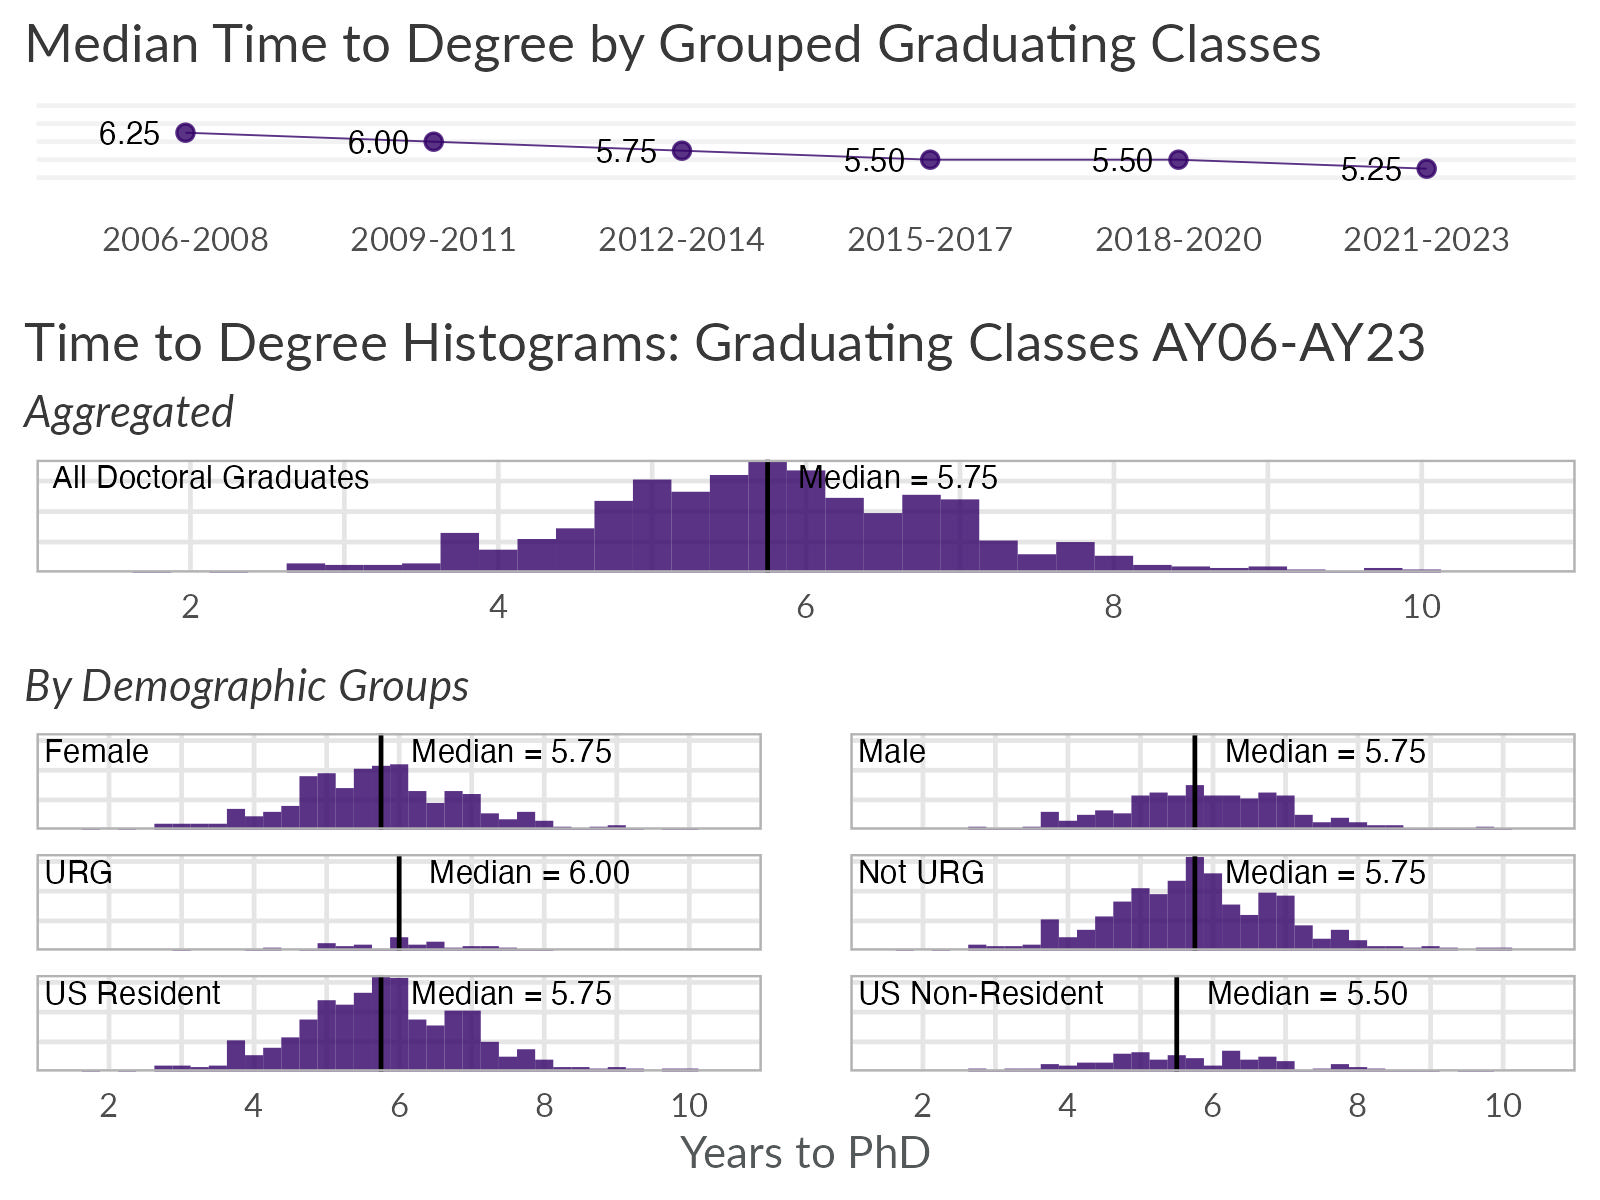
Time to Degree
Time to degree is calculated as the number of years elapsed from entry term to PhD graduation term. One term equals one quarter of a year.
Summaries are displayed by 3-year graduating classes, where each graduating class is comprised of all students who earned a PhD in a given academic year.
Median and distributions of time to degree are displayed as histograms for aggregated graduating classes AY2006-2023 for all graduates and by demographic groups. See enrollment demographics section above for demographic group definitions.
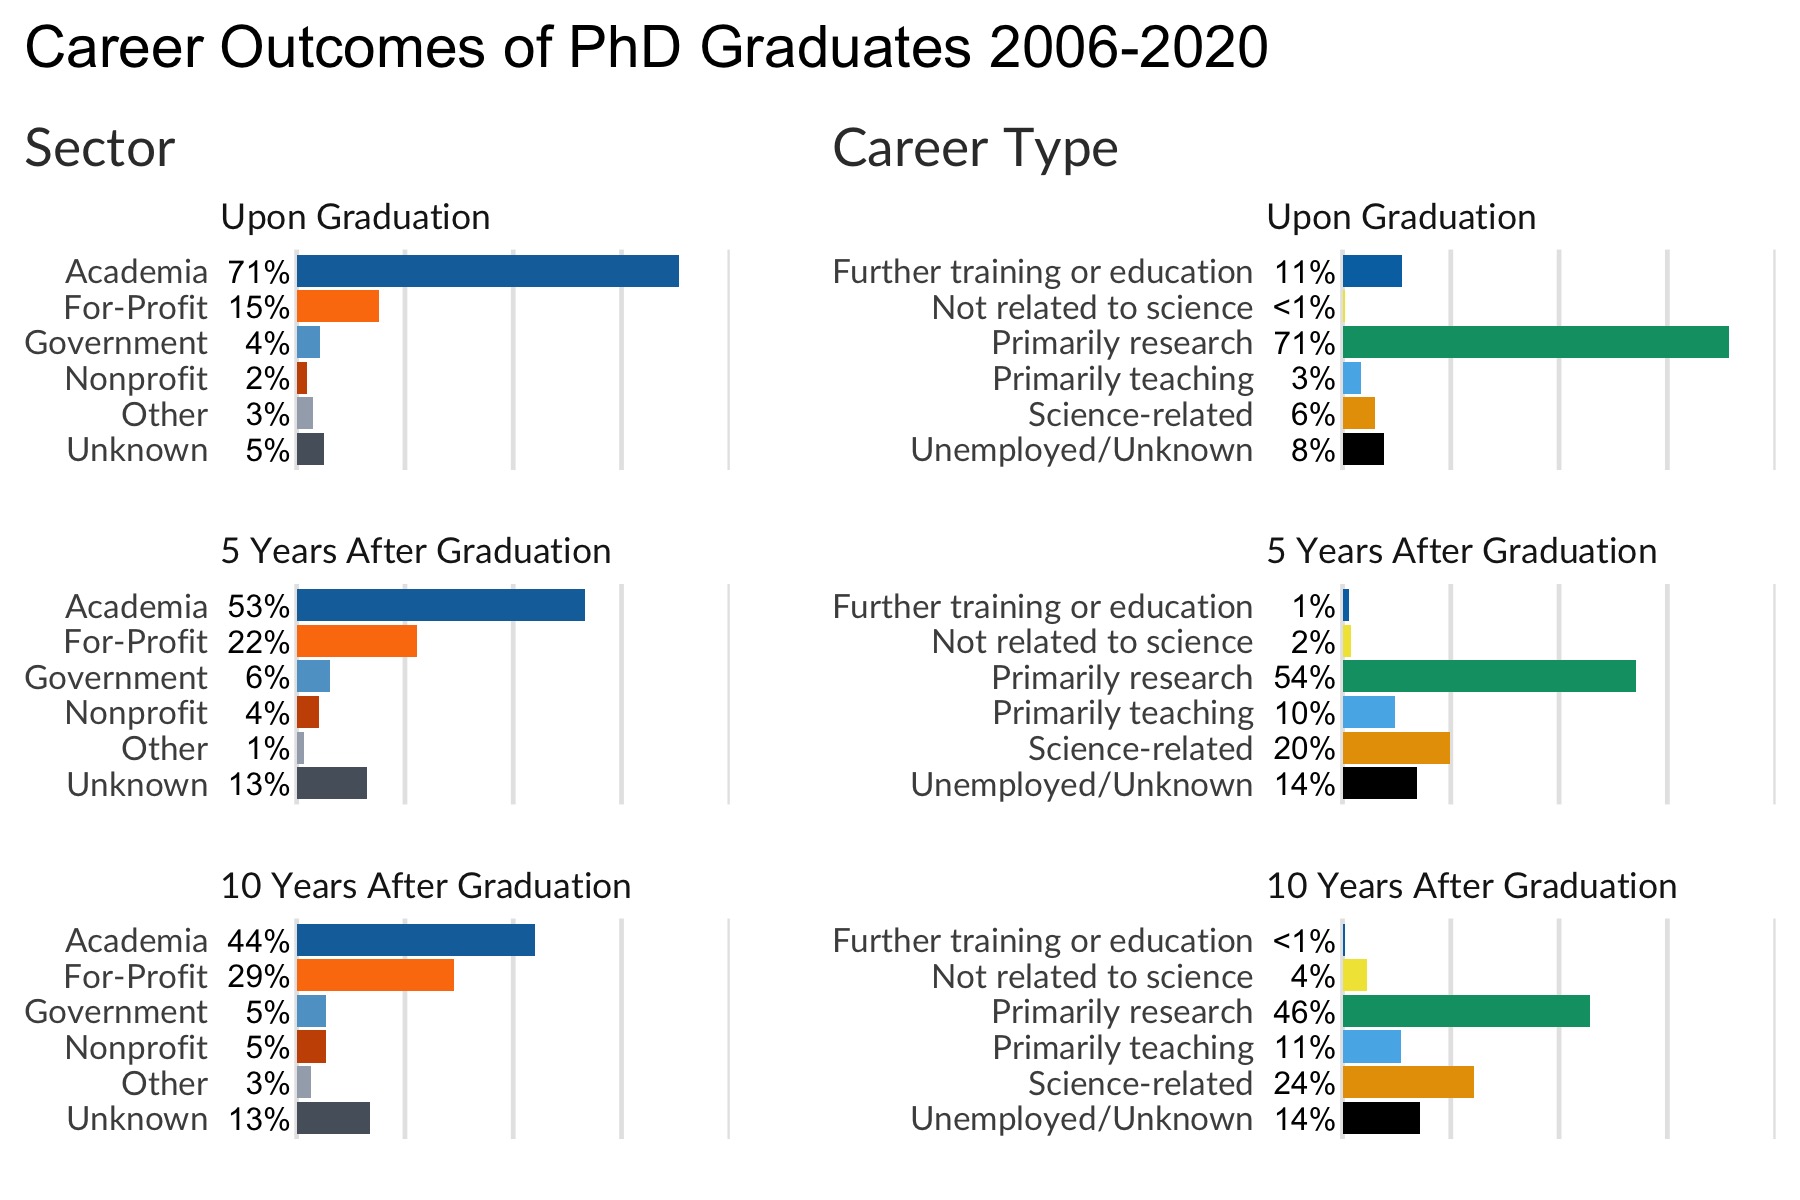
PhD Career Outcomes
Career data are collected at the time the degree was awarded (initial position), one, five, and ten years after graduation using web searches and contact with graduate programs and mentors. MD/PhD students are included in the year in which they finish their PhDs, and their initial positions are “Further training” as they return to medical school.
Beginning in 2018, Grad Studies adopted the Unified Career Outcomes Taxonomy (UCOT) v.2018 described in Stayart et.al (2018). “Applying Inter-rater Reliability to Improve Consistency in Classifying PhD Career Outcomes.”
Master's Statistics
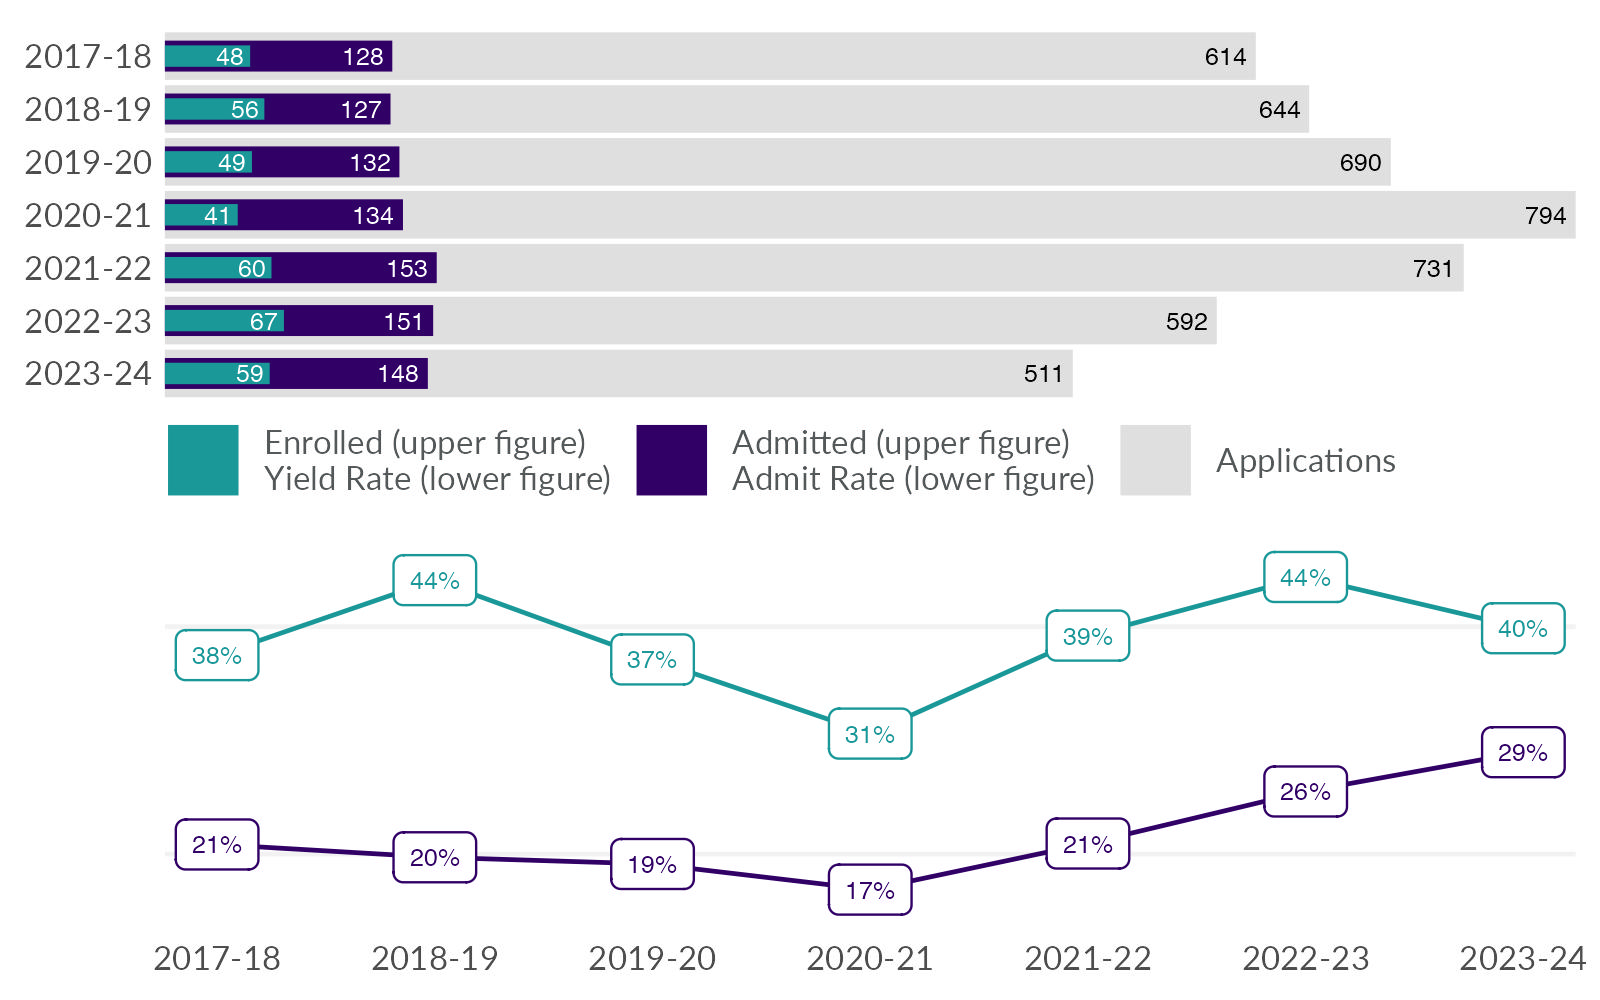
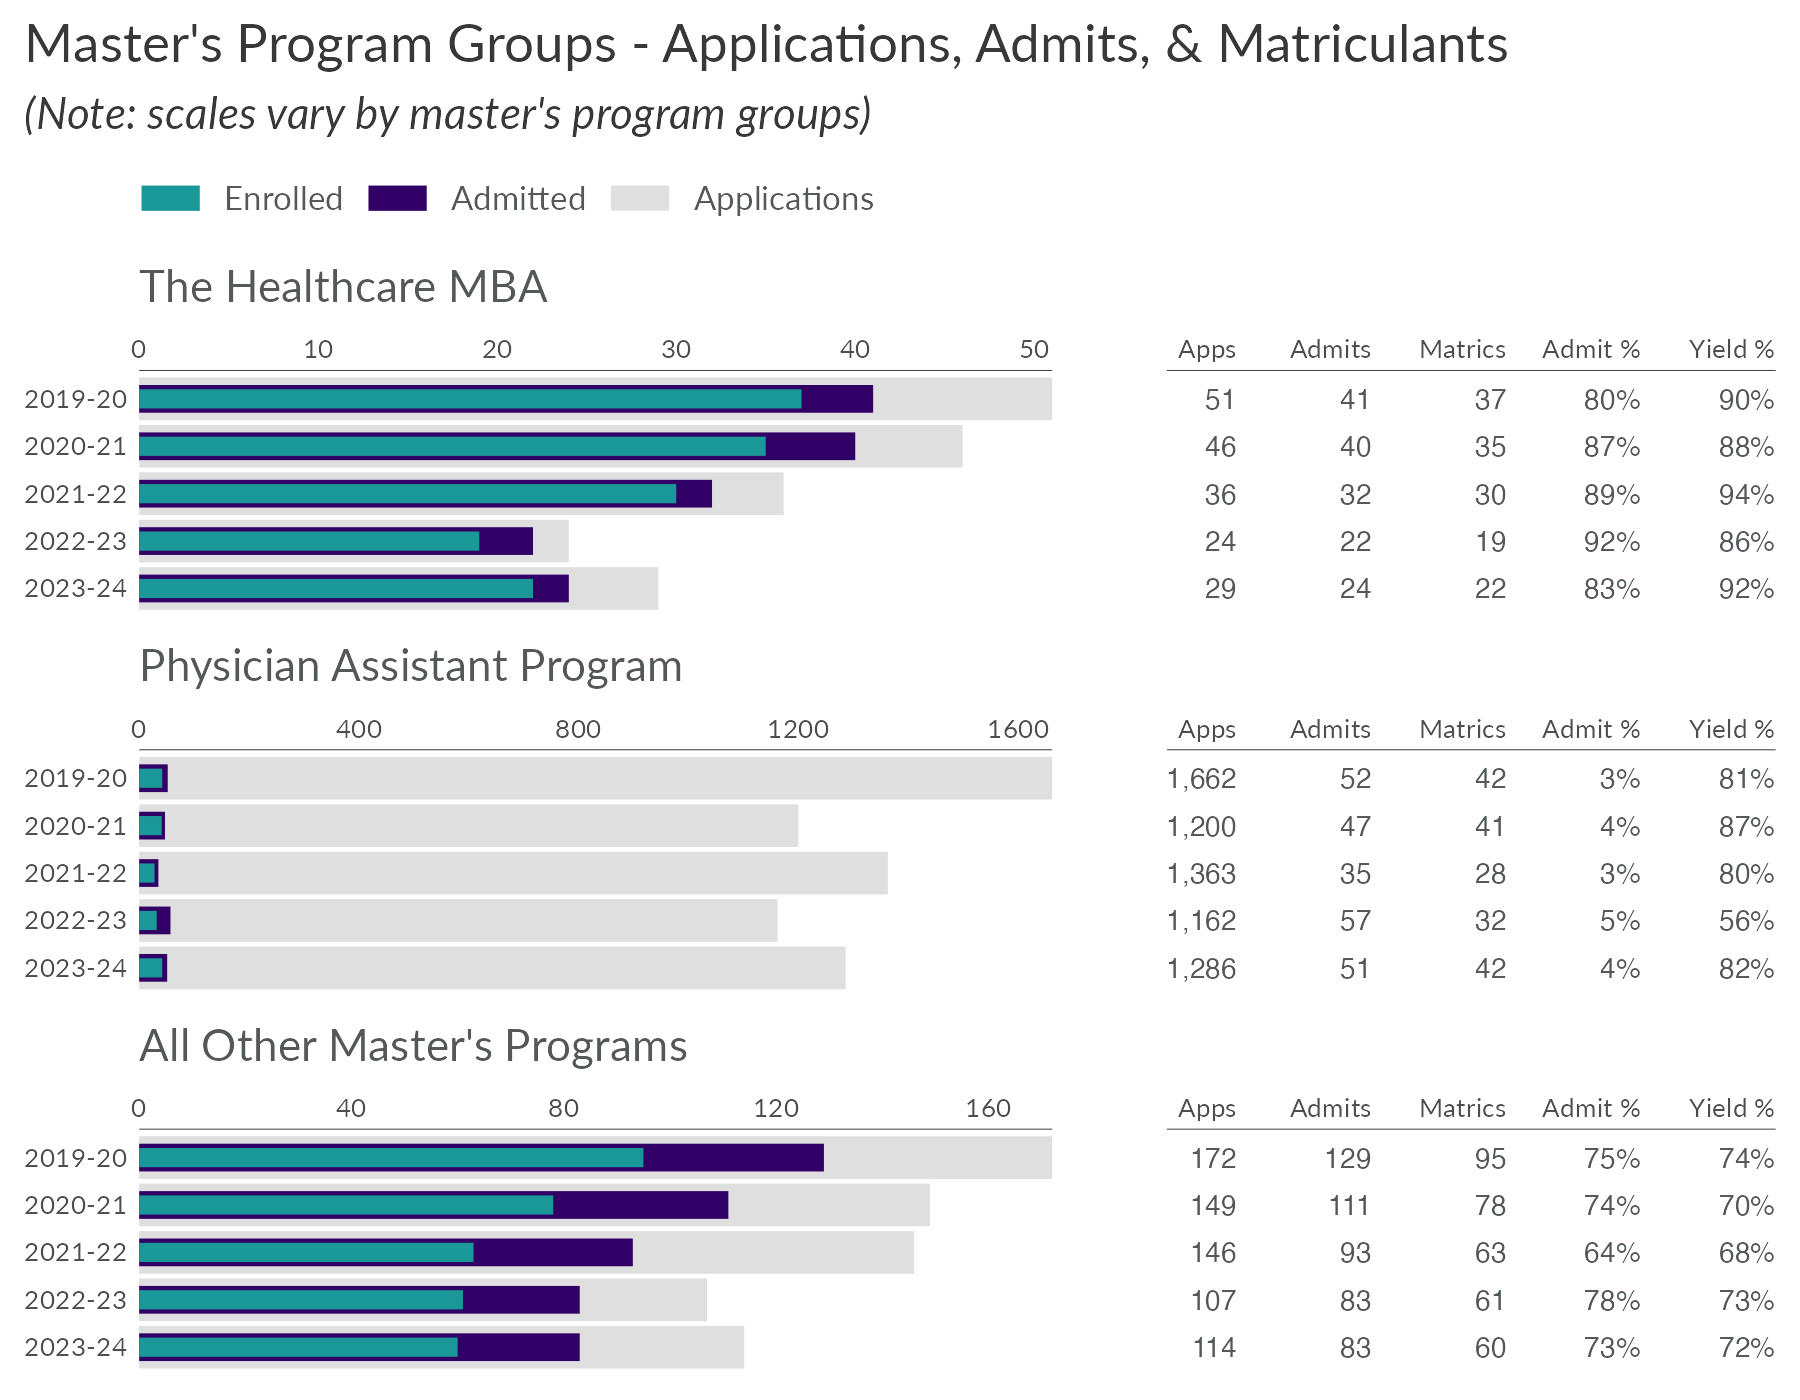
Master's Admission Summary
Includes all applicant pools from AY 2019-20 through AY 2023-24 organized by year of intended entry for all applications, admits, and matriculants. Note that matriculants are counted in the year in which they intended to start based on their application, which may differ from actual start year in some cases (e.g. deferred starts).
The two largest programs, the Healthcare MBA and Physician Assistant programs, have been separated out from all other master's degree programs.
Data valid through Fall 2023.
Admit Rate is calculated as the number of admits divided by the number of applications.
Yield Rate is calculated as the number of matriculations divided by the number of admits.
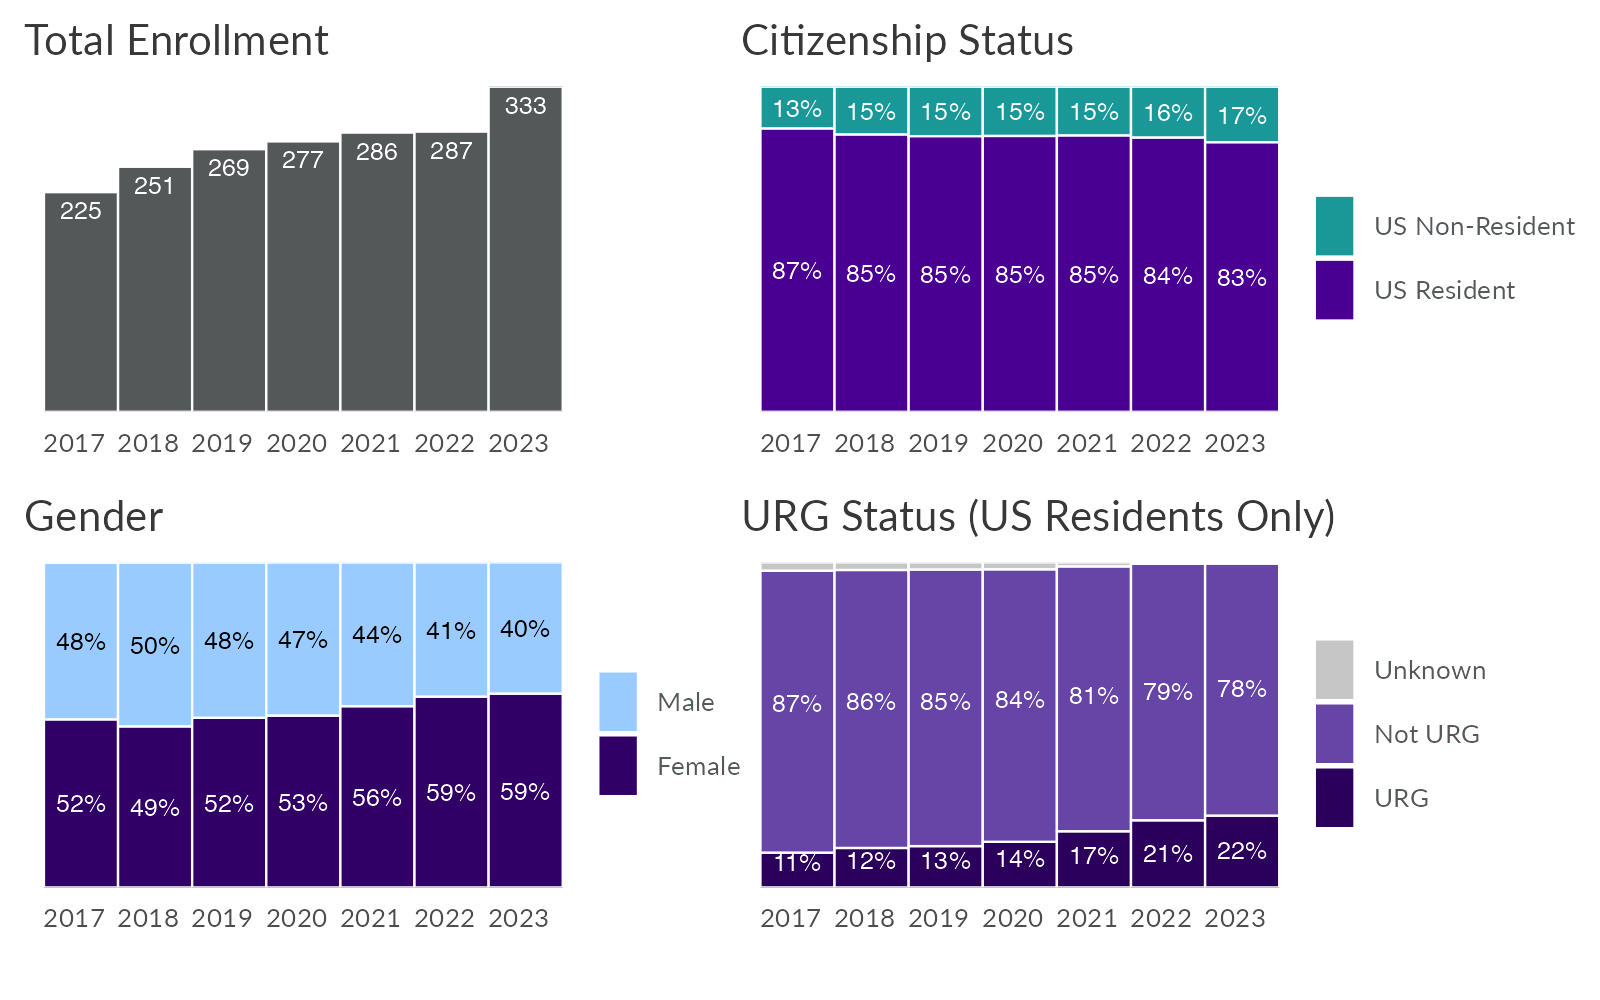
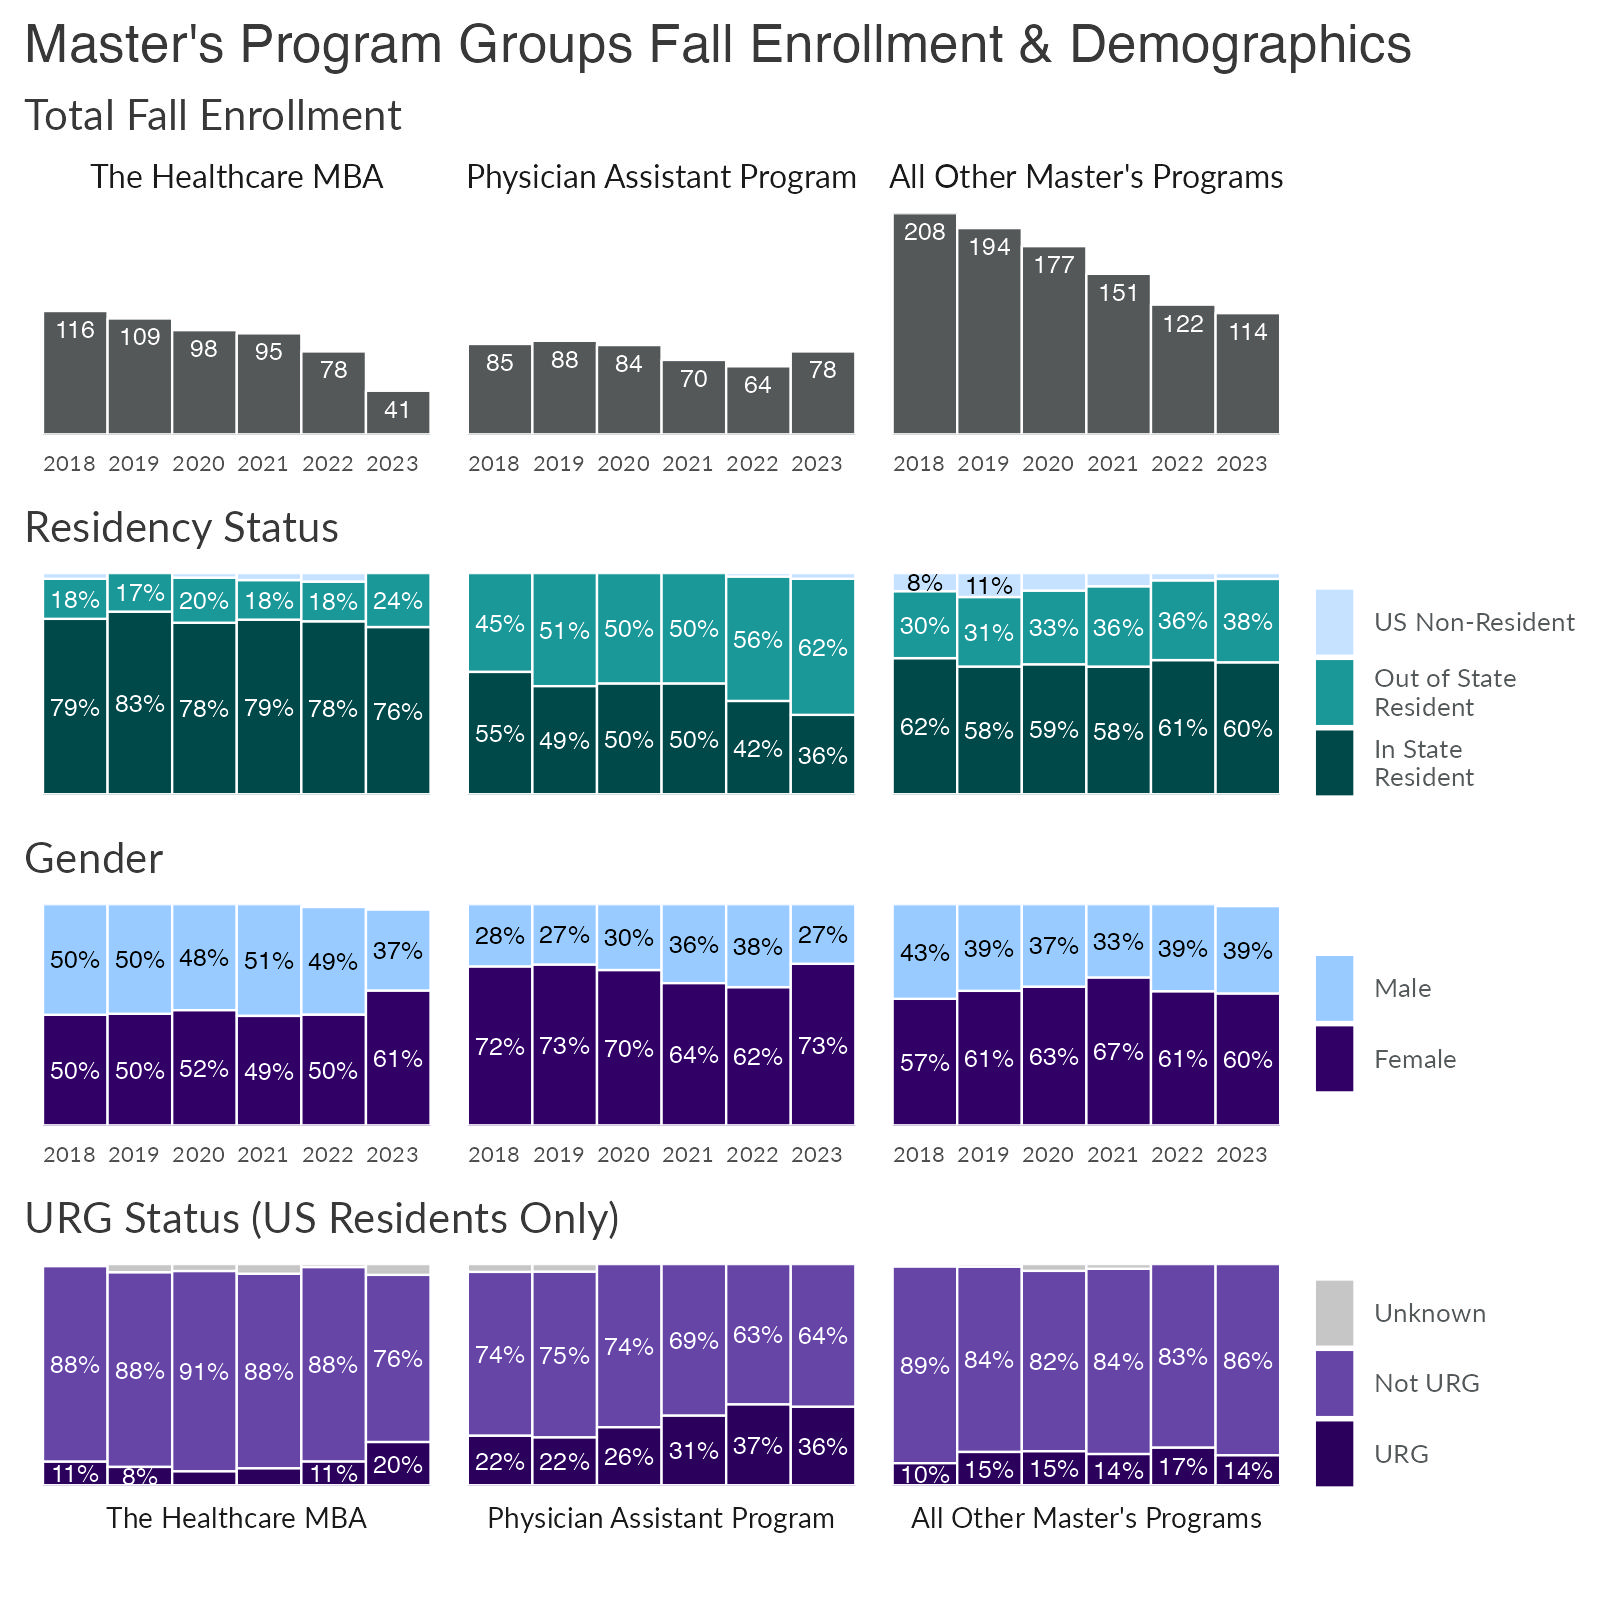
Master's Enrollment Demographics
Student enrollment is calculated for fall terms and displayed by fall term calendar year from 2018 through 2023. Students on leave or withdrawn for the term are not counted.
The two largest programs, the Healthcare MBA and Physician Assistant programs, have been separated out from all other master's degree programs.
US Resident: US citizens or permanent residents
US Non-Resident: Not a US citizen or permanent resident
Under-Represented Group (URG): Students who are US citizens or permanent residents who identify as African American/Black, American Indian/Alaska Native, Hispanic/Latino, or Native Hawaiian/Pacific Islander, or who are multiracial and identify in at least one of the preceding race and ethnic categories.
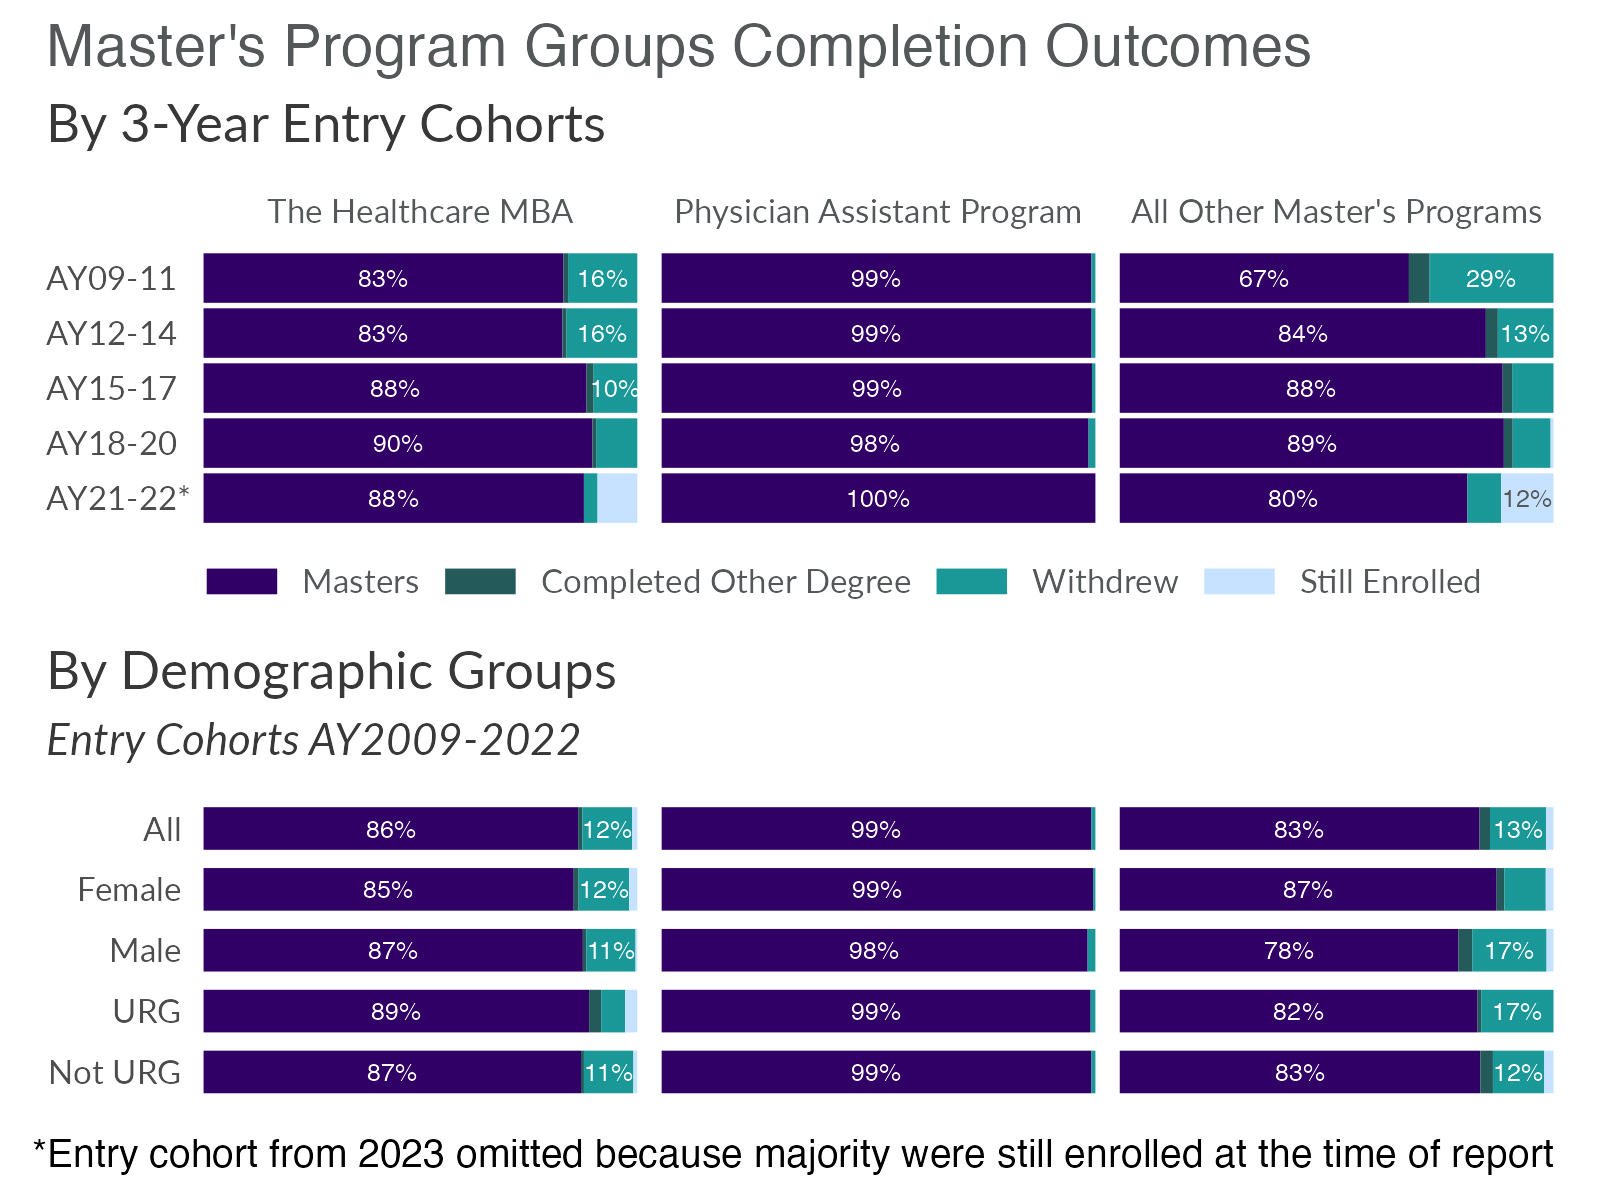
Master's Degree Completion
Completion outcomes are organized by academic years of entry based on the student's primary degree program upon matriculation.
The two largest programs, the Healthcare MBA and Physician Assistant programs, have been separated out from all other master's degree programs.
See Enrollment section for descriptions of demographic categories.