Pediatric Radiology Normal Measurements
Introduction
Knowledge of normal anatomy and its variants is critical in diagnostic radiology. This is particularly true in pediatric radiology, where normal growth and development create a broader spectrum of normal values. However, normal measurements are not always easily accessible to radiologists in their daily practice. This site is intended to allow the information to be accessible to any radiologist with internet access.
This website will demonstrate a developing database which includes selections of all major organ systems and all imaging modalities. "Normal measurements in pediatric radiology" is being compiled by pediatric radiologists from several teaching hospitals across North America. This material has previously been published in various journals and books; we have made every attempt to reproduce this information accurately and to cite references.
We realize that many valuable items could have been overlooked. However, we would like to ask all visitors to inform us of any errors of omission or commission. We hope that the easy availability of this material will stimulate further investigation to broaden and clarify it.
Disclaimer: Neither OHSU nor any of its agents warrants the accuracy of the information in these tables. Although every effort has been made to ensure accuracy and to ensure site security, of necessity we have relied on others to provide information. We hope that this information will be useful to you but we urge you to exercise your own professional judgement in using the information we have provided. Copyright © 2001
Please email OHSU Diagnostic Radiology with any questions, concerns or possible edits.
The initial project was presented as a scientific exhibit at the 1999 annual meeting of the Society for Pediatric Radiology. The authors of the initial project were Kryss Kojima MD, Robert Thomas MD, and Phillip Silberberg MD. The scope of the webpage has been widened. The newer version was accepted as a scientific exhibit at the International Pediatric Radiology Meeting in Paris, May 2001. Since then, the list of co-authors of the project increased, with authorities who have published widely in the literature about pediatric radiology including all the major organ systems and imaging modalities.
The medical illustrations have all been drawn by the late Jose Rodriguez, unless referenced to another work. Jose also worked as a Spanish interpreter at Doernbecher Children's Hospital and Oregon Health & Science University.
We appreciate the feedback given to us by N. Thorne Griscom, Andrew Poznanski, and Stuart Royal and all those who have worked on the web aspect of this project: Tippi Etzel, Elizabeth Gray, Jon Hanada, Mary Ann Hanada, and Karl Simon.
Sincerely,
Phillip Silberberg, MD
Kryss Kojima, MD, Radiology Resident1
Robert Thomas, MD, Assistant Professor of Radiology1,2
Phillip Silberberg, MD, Assistant Professor of Radiology and Pediatrics1,2
Jose Rodriguez, Medical Illustrator2*
Tippi Etzel, Web Manager1
1Department of Radiology, Oregon Health & Science University.
2Doernbecher Children's Hospital
*All illustrations, unless referenced to another work.
Chest
Aorta
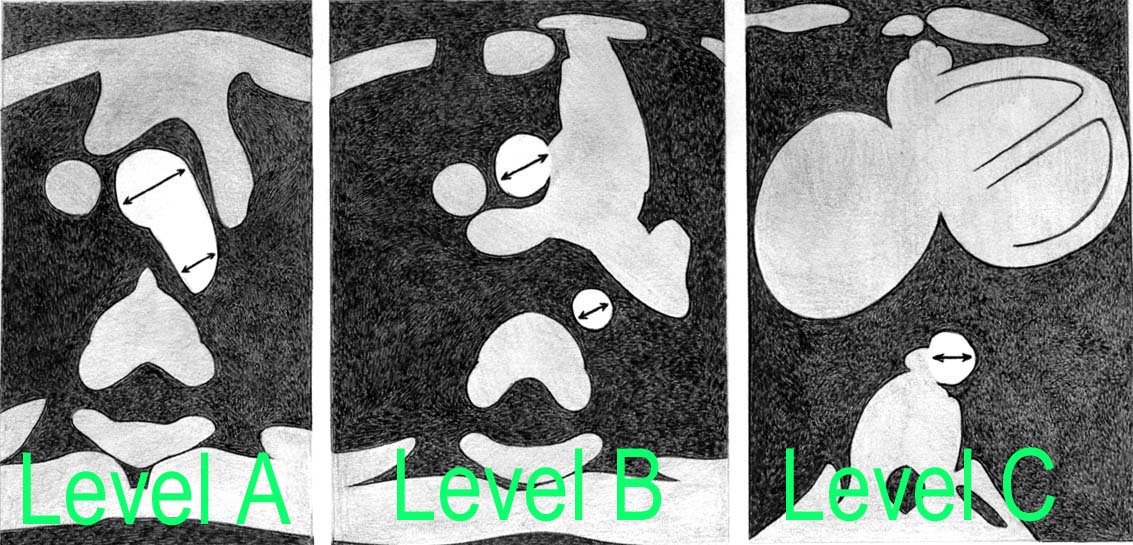
Measurement of pediatric thoracic aorta1
From contrast enhanced axial CT
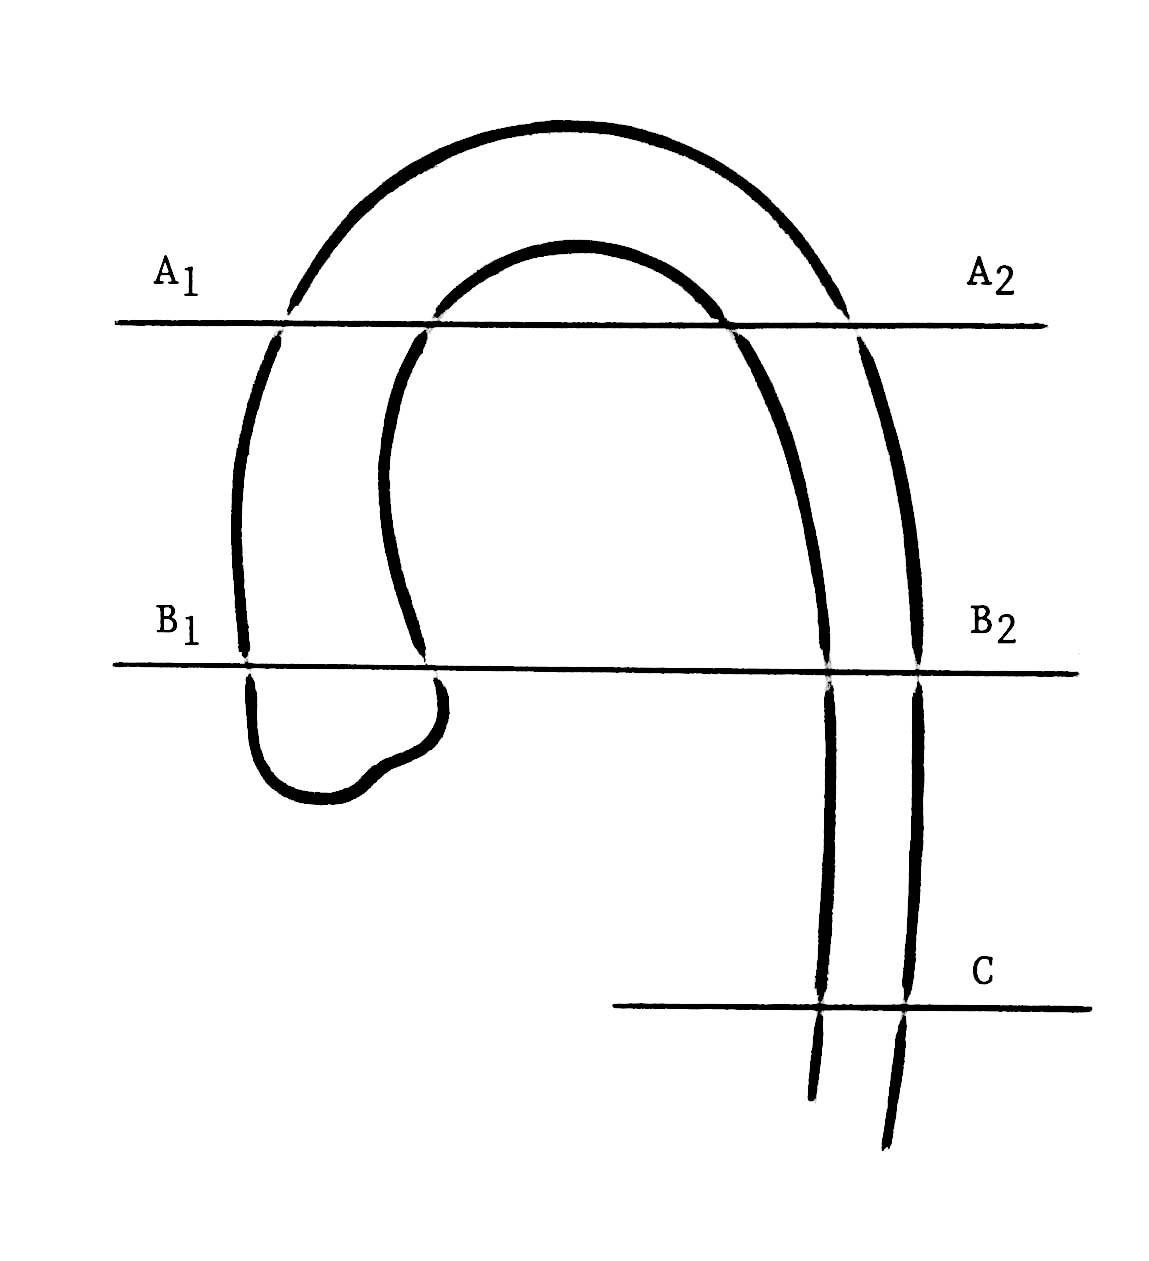
Key:
Level A = 1 cm below aortic arch
Level B = 1 cm cranial to aortic root
Level C = 1 cm cranial to dome of right hemidiaphragm
A1 = (0.72 x age) + 11.55 mm
A2 = (0.629 x age) + 9.54 mm
B1 = (0.668 x age) + 13 mm
B2 = (0.572 x age) + 9.56 mm
C = (0.559 x age) + 8.44 mm
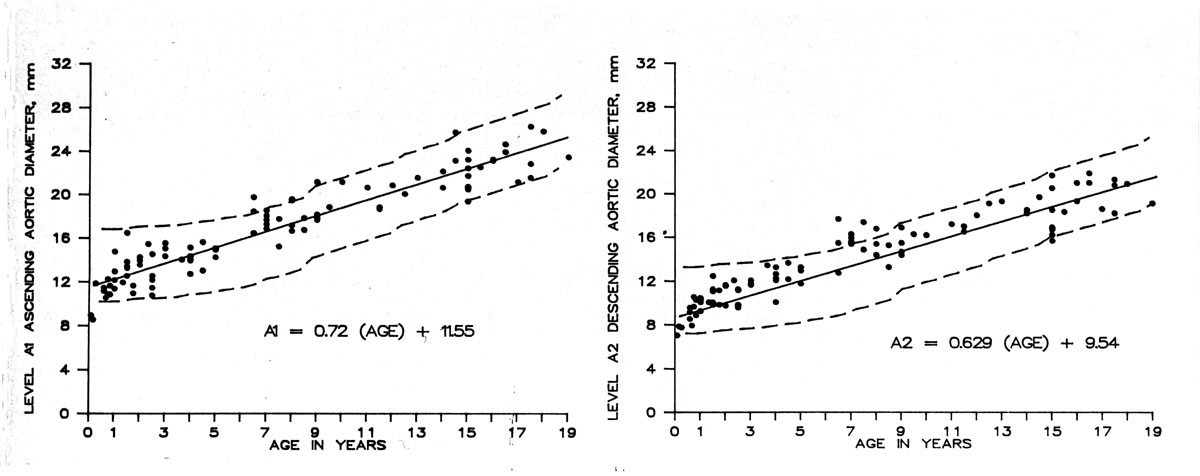
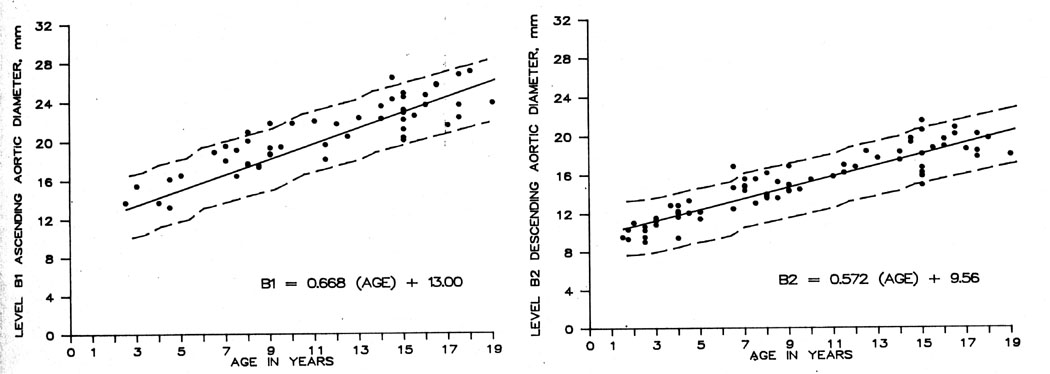
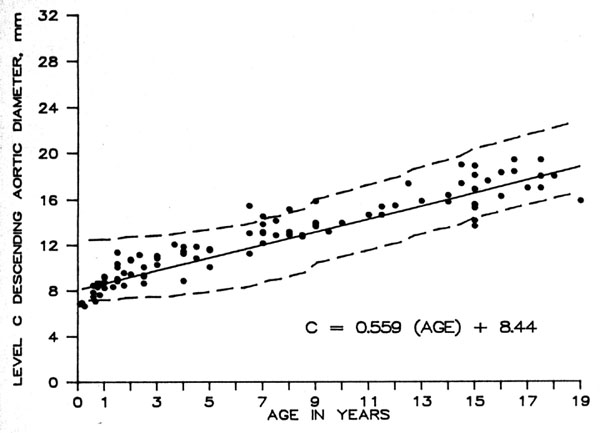
Above regression charts plot mean with 95% confidence limits.
Reference: Fitzgerald SW, Donaldson JS, Poznanski AK. Pediatric thoracic aorta: Normal measurements determined with CT. Radiology 1987; 165:667-669 (Used with permission from author: awaiting permission from publisher)
Bronchi
Bronchietasis is defined by a bronchus-to-artery ratio of >1.2 on chest radiographs 1§.
§ Based on the external diameters of both the pulmonary arteries and bronchi on chest radiographs.
Normal bronchi are not usually seen in the most peripheral 5 to 10 mm of the lung on CT 2.
References:
- 1. Woodring JH. Pulmonary artery-bronchus ratios in patients with normal lungs, pulmonary vascular plethora, and congestive heart failure. Radiology 1991; 179:115-22.
- 2. Siegel MJ. Pediatric Body CT. Lippincott Williams & Wilkins: Philadelphia. 1999. p. 101.
Cardiothoracic index
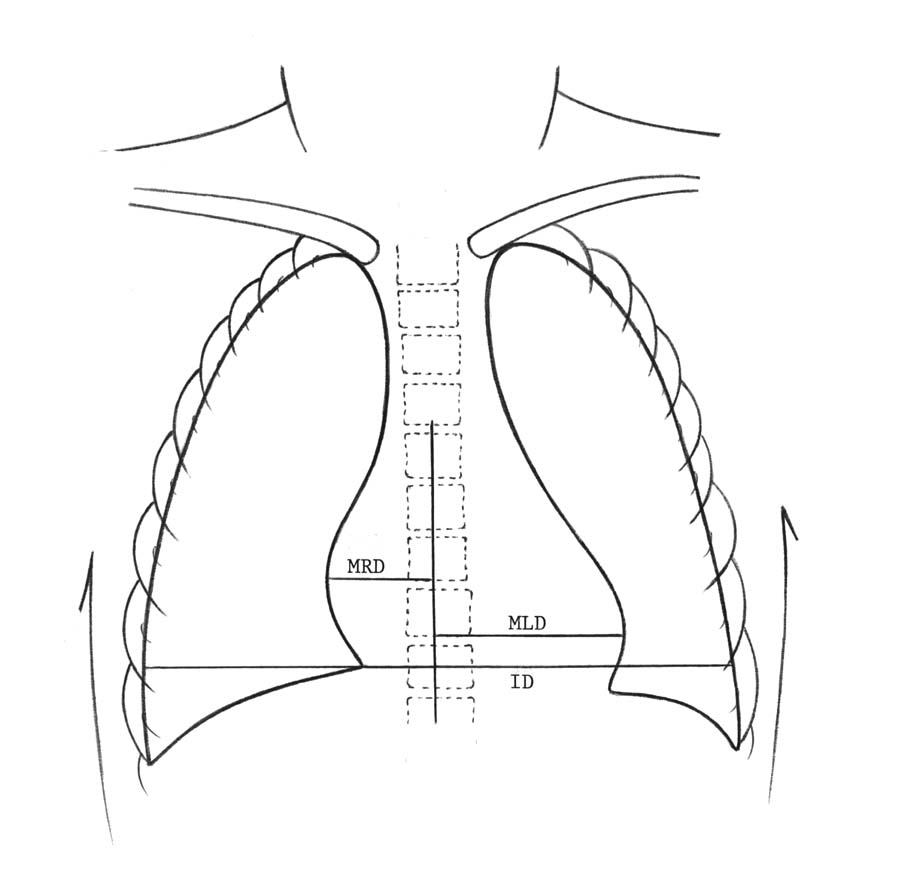
(made on upright frontal view of chest at 72 inches during quiet breathing)
(re-drawn from Caffey J. Pediatric X-ray Diagnosis. 7th Ed. 1978, p 543)
ID = internal diameter of chest at level of right hemidiaphragm
MRD = greatest perpendicular diameter from midline to right heart border
MLD = greatest perpendicular diameter from midline to left heart border
CT index = (MRD + MLD)/ID
| Age | Mean CT index | Standard deviation X 1 | Range |
|---|---|---|---|
| 0-3 weeks (ref#1) | 0.55 | 0.05 | 0.65-0.45 |
| 4-7 weeks (ref#1) | 0.58 | 0.06 | 0.70-0.46 |
| 1 year (ref#1) | 0.53 | 0.04 | 0.61-0.45 |
| 1-2 years (ref#2) | 0.49 | 0.60-0.39 | |
| 2-6 year (ref#2) | .045 | 0.52- 0.40 | |
| >7 years (ref#2) | <0.50 | 0.50- 0.40 |
Comments
1st year of life, larger CT index due to more transverse heart position in chest compared to older children and adults, and from data derived from films obtained in expiratory phase of respiration. Data in infants and young children obtained from supine films at 1.5m distance.
- Bakwin H, Bakwin R. Body build in infants: VI. Growth of the cardiac silhouette and the thoraco-abdominal cavity. Am J Dis Child. 49:861, 1935
- Maresh MM, Washburn AH. Size of the heart in healthy children. Am J Dis Child 56:33, 1938
- Lincoln EM, Spillman R. Studies of the hearts of normal children: II. Roentgen ray studies. Am J Dis Child 35:791, 1928.
Retropharyngeal and retrotracheal soft tissues
Retrotracheal soft tissues
lateral radiographs of the neck
| Age (years) | Maximum (mm) |
|---|---|
| 0-1 | 2.0 x C5* |
| 1-2 | 1.5 x C5 |
| 2-14 | 1.2 x C5 |
Retropharyngeal soft tissues
lateral radiographs of the neck
| Age (years) | Maximum (mm) |
|---|---|
| 0-1 | 1.5 x C5* |
| 1-3 | 0.5 x C5 |
| 3-6 | 0.4 x C5 |
| 6-14 | 0.3 x C5 |
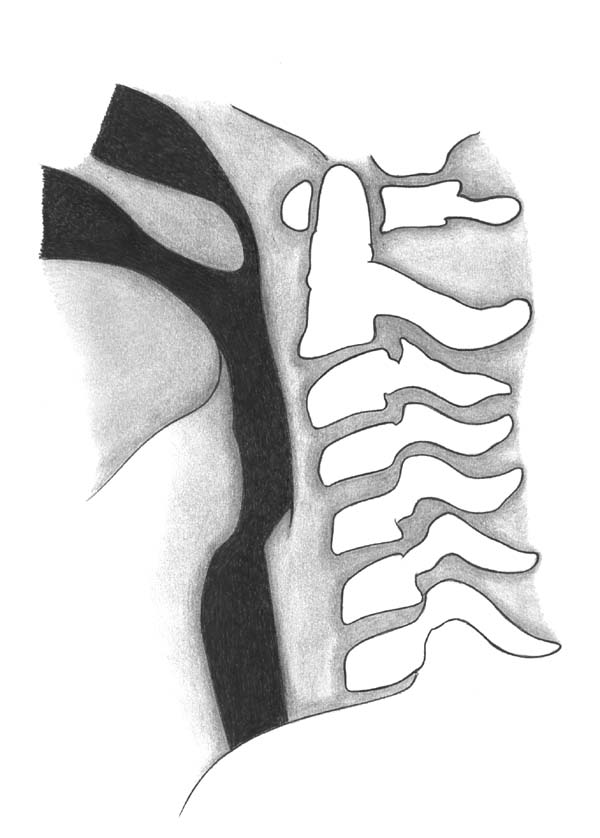
*measurement made at mid-portion of C5 vertebral body on lateral radiograph
Note: expiratory phase and flexion of neck increases apparent thickness of tissues artifactually.
Rule of 7's:
- no greater than 7mm for retropharyngeal soft tissues
- no greater than 14mm for retrotracheal soft tissues 2
References:
- Hay PD, Jr. The Neck: A roentgenological study of the soft tissues: Consideration of the normal and pathological. III. Normal necks (infants and children). Ann Roentgenol Vol 9. New York: Hoever, 1930, p22-8
- Redman HC, Purdy PD, Miller GL, Rollins NK. Emergency Radiology. Cervical Spine. W.B. Saunders 1993. p 183-186.
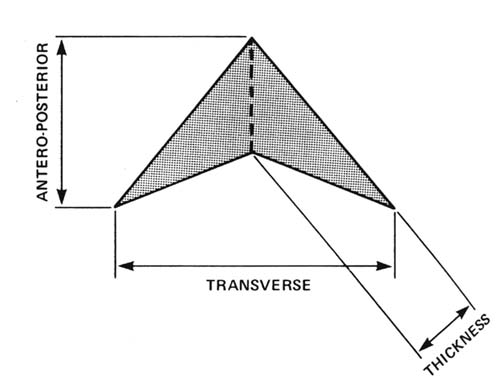
Thymus
Normal measurements of the thymus on CT: mean values
| Age (y) | AP diameter in cm (SD) | Thickness of limbs in cm (SD) | Craniocaudal length in cm (SD) | Width in cm (SD) |
|---|---|---|---|---|
| 0-10 | 2.52 (0.82) | 1.5 (0.46) | 3.53 (0.99) | 3.13 (0.85) |
| 10-20 | 2.56 (0.88) | 1.05 (0.36) | 4.99 (1.25) | 3.05 (1.17) |
Reference:
- Francis IR, Glazer GM, Bookstein FL, Gross BH. The thymus: reexaminatinon of age-related changes in size and shape. AJR 1985; 145:249-254. Table and diagram used with permission.
Endocrine
Thyroid
Sonographic normal thyroid lobe measurements (cm)
| Age | Transverse (cm) | Logitudinal (cm) | AP (cm) |
|---|---|---|---|
| Infants & Young Children | 1-1.5 | 2-3 | .02-1.2 |
| Adolescents & Adults | 2-4 | 5-8 | 1-2.5 |
References
- Cole-Beuglet C. Ultrasonography of the thyroid, parathyroid and neck masses. In: Sarti DA, ed. Diagnostic ultrasound: text and cases. Chicago: Year Book Medical Publishers; 1987:608-618. (Modified)
Gastrointestinal
Appendix
Normal appendix
| Modality | Transverse diameter (mm) | Appendiceal wall thickness (mm) |
|---|---|---|
| US | < 6 (& compressible) | Usually < 2 |
| CT | <8 | <2-4 |
References:
- Kao SC, Smith WL, Abu-Yousef MM, et al. Acute appendicitis in children: sonographic findings. AJR 1989; 153:375-379.
- Curtin KR, Fitzgerald SW, Nemcek AA, Hoff FL, Vogelzang RL. CT diagnosis of acute appendicitis: imaging findings. AJR 1995; 164:905-909.
Gallbladder and biliary tract
Sonographic measurements of the normal pediatric gallbladder and biliary tract
Normal gallbladder measurements vs. age 1
| Age (y) | AP Diameter Mean (cm) | AP Diameter Range (cm) | Coronal Diameter Mean (cm) | Coronal Diameter Range (cm) | Length Mean (cm) | Length Range (cm) | Wall thickness Mean (mm) | Wall thickness Range (mm) |
|---|---|---|---|---|---|---|---|---|
| 0-1 | 0.9 | 0.5-1.2 | 0.9 | 0.7-1.4 | 2.5 | 1.3-3.4 | 1.7 | 1.0-3.0 |
| 2-5 | 1.7 | 1.4-2.3 | 1.8 | 1.0-3.9 | 4.2 | 2.9-5.2 | 2.0 | None |
| 6-8 | 1.8 | 1.0-2.4 | 2.0 | 1.2-3.0 | 5.6 | 4.4-7.4 | 2.2 | 2.0-3.0 |
| 9-11 | 1.9 | 1.2-3.2 | 2.0 | 1.0-3.6 | 5.5 | 3.4-6.5 | 2.0 | 1.0-3.0 |
| 12-16 | 2.0 | 1.3-2.8 | 2.1 | 1.6-3.0 | 6.1 | 3.8-8.0 | 2.0 | 1.0-3.0 |
Normal sonographic common hepatic duct sizes vs. age 1
| Age (y) | Common hepatic duct size mean (mm) | Common hepatic duct size range (mm) |
|---|---|---|
| 0-1 | 1.3 | 1.0-2.0 |
| 2-5 | 1.7 | 1.0-3.0 |
| 6-8 | 2.0 | none |
| 9-11 | 1.8 | 1.0-3.0 |
| 12-16 | 2.2 | 1.0-4.0 |
References:
- McGahan JP, Phillips HE, Cox KL. Sonography of the normal pediatric gallbladder and biliary tract. Radiology 1982; 144(4): 873-875. Tables modified and used with permission for this Website.
GI tract
Normal GI tract: wall thickness on CT
| Organ | Wall thickness (mm) |
|---|---|
| Stomach | 3-5 |
| Duodenum | ≤ 3 |
| Colon | ≤ 3 |
References:
- Desai RK, Tagliabue JR, Wegryn SA, Einstein DM. CT evaluation of wall thickening in the the alimentary tract. Radiographics 1991;11:771-783.
- Fisher JK. Abnormal colonic wall thickening on computed tomography. J comput assist tomogr 1983; 7: 90-97.
- In Siegel MJ. Pediatric Body CT. Lippincott Williams & Wilkins: Philadelphia. 1999. pp 204, 207, 219.
Lymph nodes on CT
Normal abdominal lymph nodes in adolescents and adults: CT¹
| Location | Short axis nodal diameter (mm) |
|---|---|
| Retrocural | ≤6 |
| Paracardiac | ≤8 |
| Mediastinal | <10² |
| Gastrohepatic ligament | ≤8 |
| Upper paraaortic | ≤9 |
| Portacaval | ≤10 |
| Portahepatis | ≤7 |
| Lower paraaortic | ≤11 |
References:
- Dorfman RE, Alpern MB, Gross BH, Sandler MA. Upper abdominal lymph nodes:criteria for normal size determined with CT. Radiology 1991; 180:319-322. Table modified and used with permission for this Website.
- Newman B, Arcement CM, Siegel MJ. CT and MR imaging of mediastinal masses in children. Current Concepts in Body Imaging at the Millenium. RSNA Syllabus 1999
Pancreas and pancreatic duct
Normal pancreas size as a function of age (ultrasound)*¹
| Age | Head in cm (± 1 SD) | Body in cm (± 1 SD) | Tail in cm (± 1 SD) |
|---|---|---|---|
| < 1 month | 1.0 ± 0.4 | 0.6 ± 0.2 | 1.0 ± 0.4 |
| 1 month to 1 year | 1.5 ± 0.5 | 0.8 ± 0.3 | 1.2 ± 0.4 |
| 1 to 5 years | 1.7 ± 0.3 | 1.0 ± 0.2 | 1.8 ± 0.4 |
| 5 to 10 years | 1.6 ± 0.4 | 1.0 ± 0.3 | 1.8 ± 0.4 |
| 10 to 19 years | 2.0 ± 0.5 | 1.1 ± 0.3 | 2.0 ± 0.4 |
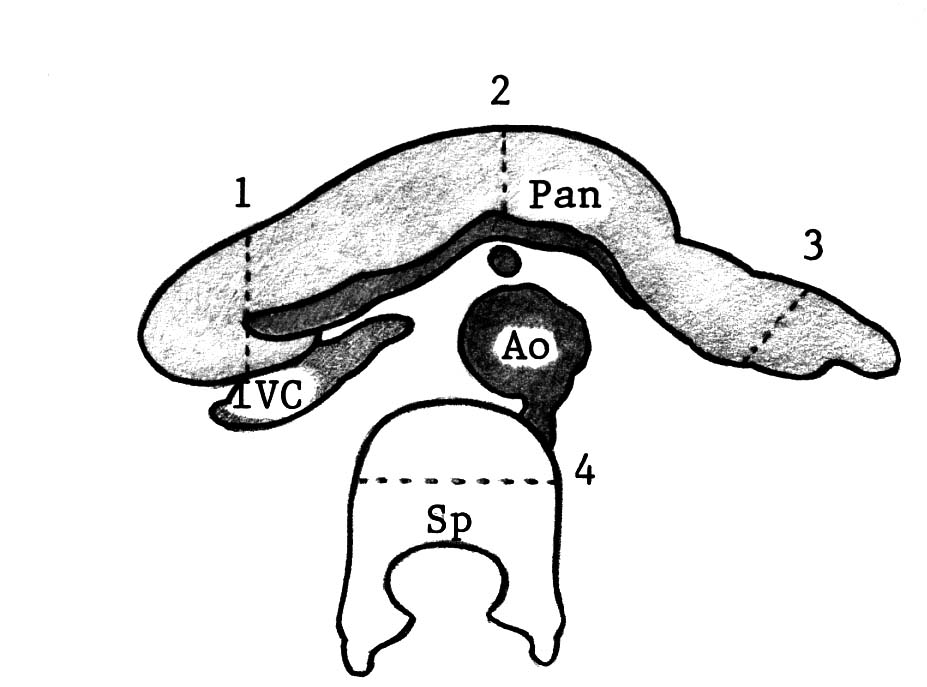
*Measured as maximum AP on transverse scan
The normal pancreatic duct is less than 2 mm in diameter
Computed Tomography: The craniocaudal dimension of the head ranges from 2 to 6 cm, while the body and tail ranges from 2 to 4 cm.2
References:
- Siegel MJ, Martin KW, Worthington JL. Normal and abnormal pancreas in children: US studies. Radiology 1987; 165:15-18. Table 1 used with permission.
- Siegel MJ. Pediatric Body CT. Lippincott Williams & Wilkins: Philadelphia. 1999. p 263.
Portal vein
Normal main portal vein size on ultrasound as a function of age
| Age | Main portal vein transverse diameter (mm) |
|---|---|
| <10 years | 8.5 ± 2.7 |
| 10 to 20 years | 10 ± 2 |
References:
- Patriquin HB, Perreault G, Grignon A, et al. Normal portal venous diameter in children. Pediatric Radiol 1990; 20: 451-453.
- Weinreb J, Kumari S, Phillips G, Pochaczevsky R. Portal vein measurements by real-time sonography. AJR 1982; 139(3):497-499. In source: Siegel MJ. Pediatric Sonography. Raven Press: New York. 1995 . p 175.
Pylorus
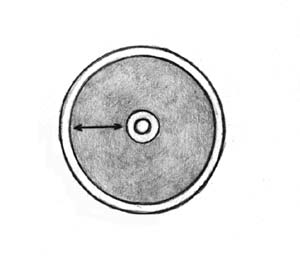
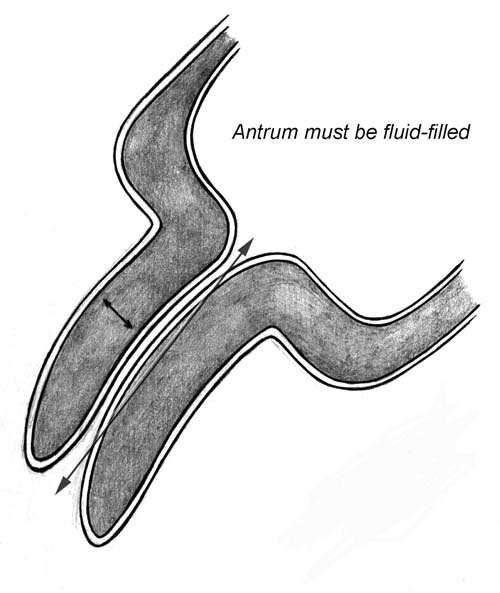
Muscle wall thickness: measured as a single hypoechoic layer between serosa and echogenic submucosa. (muscle thickness exaggerated for illustration)
NOTE: PRETERM INFANTS. Borderline muscle thickness measurements are more likely to occur in premature infants than in term infants. In preterm infants, the thickness of the pyloric muscle relative to the rest of the stomach and the pyloric canal length is more important than the absolute muscle thickness.
References:
- Blumhagen JD, Maclin L, Krauter D, Rosenbaum DM, Weinberger E. Sonographic diagnosis of hypertophic pyloric stenosis. AJR 1988; 150:1367-1370.
- Blumhagen JD, Weinberger E. Pediatric gastrointestinal ultrasounography. In : Ultrasound annual. New York: Raven Press; 1986; 99-140.
- O'Keefe FN, Stansberry SD, Swischuk LE, Hayden CK Jr. Antropyloric muscle thickness at US in infants: what is normal? Radiology 1991; 178: 827-830.
- Rollins MD, Shields MD, Quinn RJM, et al. Pyloric stenosis: congenital or acquired? Arch Dis Child 1989; 64:138-147.
Spleen
Ultrasound: normal spleen size vs. age¹
| Age | Spleen length (cm)* |
|---|---|
| 0-3 months | ≤ 6 |
| 3-6 months | ≤ 6.5 |
| 6-12 months | ≤ 7 |
| 1-2 years | ≤ 8 |
| 2-4 years | ≤ 9 |
| 4-6 years | ≤ 9.5 |
| 6-8 years | ≤ 10 |
| 8-10 years | ≤ 11 |
| 10-12 years | ≤ 11.5 |
| 12-15 years | ≤ 12 |
| 15-20 years (female) | ≤ 12 (female) |
| 15-20 years (male) | ≤ 13 (male) |
*Measurement obtained in the coronal longitudinal plane
References
- Rosenberg HK, Markowitz RI, Kolbeg H, et al. Normal splenic size in infants and children: sonographic measurements. AJR 1991; 157:119-121. Table modified and used with permission.
Genitourinary
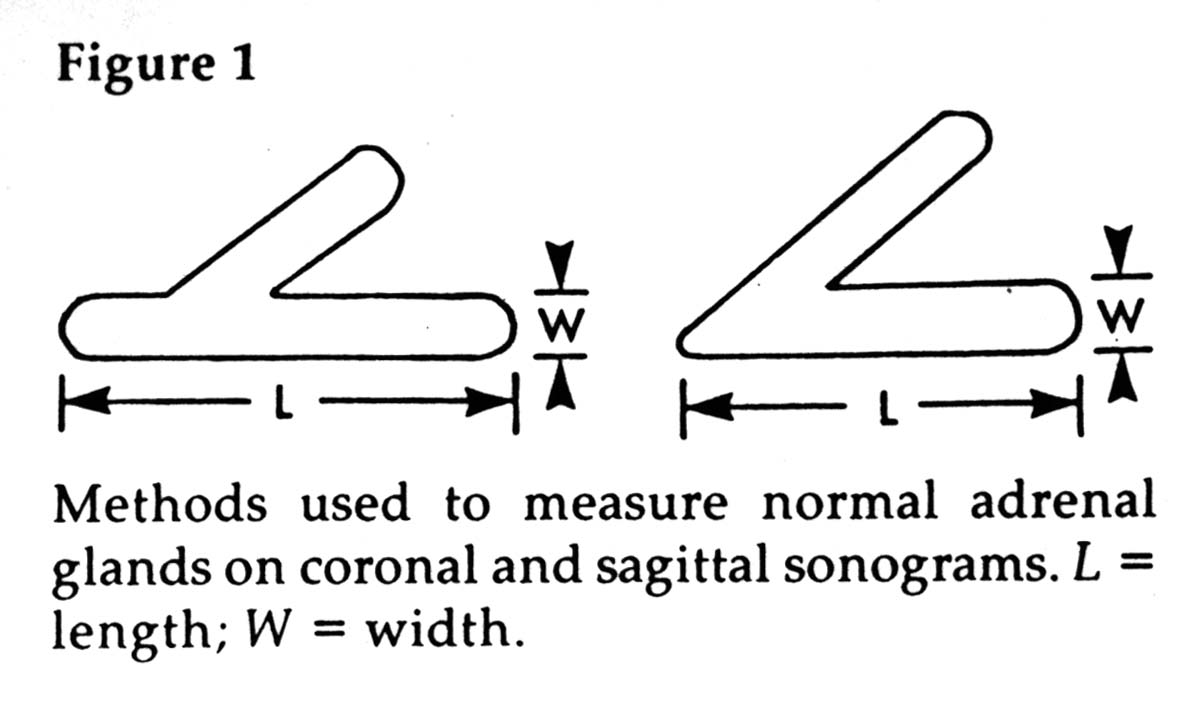
Adrenal gland
Normal adrenal gland size as a function of age¹
| Age | Length (cm) | Thickness (cm) | Width (cm) |
|---|---|---|---|
| Neonate | 0.9 - 3.6 (mean, 1.5) | 0.2 - 0.5 (mean, 0.3) | 0.2 - 0.5 (mean, 0.3) |
| Adult | 4 - 6 | 0.2 - 0.6 | 2 - 3 |
| Age | Shape and size | Echogenicity |
|---|---|---|
| Newborn | Cortex>>Medulla thickness Convex borders | Cortex hypoechoic Medulla hyperchoic |
| 1.5 to 2 months | Changes gradually to medulla>cortex thickness Convex borders | Cortex hypoechoic Medulla hyperechoic |
| 5 to 6 months | Decreasing size Straight borders | Hyperechoic, loss of corticomedullary differentiation |
| > 1 year | Adult appearance Concave/straight margins | Entirely hypoechoic |
References:
- Oppenheimer DA, Carroll BA, Yousem S. Sonography of the normal neonatal adrenal gland. Radiology 146:157-160, January 1983 Diagram used with permission for this Website.
- Kangarloo H, Diament MJ, Gold RH, et al. Sonography of adrenal glands in neonates and children: changes in appearance with age. J Clin ultrasound. 1986; 14: 43-47. (modified)
Ovaries
Normal ovarian size as a function of age
| Age group | Mean ovarian volume (ml)* | SD (ml) | 95% Confidence interval | % Ovaries imaged |
|---|---|---|---|---|
| 1 day to 3 months (ref#1) | 1.06 | 0.96 | 0.03-3.56 | 70 |
| 4-12 months (ref#1) | 1.05 | 0.67 | 0.18-2.71 | 100 |
| 13-24 months (ref#1) | 0.67 | 0.35 | 0.15-1.68 | 90 |
| 2 years (ref#2) | 0.8 | 0.4 | ||
| 3 years (ref#2) | 0.7 | 0.2 | ||
| 4 years (ref#2) | 0.8 | 0.4 | ||
| 5 years (ref#2) | 0.9 | 0.02 | ||
| 6 years (ref#2) | 1.2 | 0.4 | ||
| 7 years (ref#2) | 1.3 | 0.6 | ||
| 8 years (ref#2) | 1.1 | 0.5 | ||
| 9 years (ref#2) | 2 | 0.8 | ||
| 10 years (ref#2) | 2.2 | 0.7 | ||
| 11 years (ref#2) | 2.5 | 1.3 | ||
| 12 years (ref#2) | 3.8 | 1.4 | ||
| 13 years (ref#2) | 4.2 | 2.3 | ||
| Menstruating Females (ref#3) | 9.8 | 5.8 | 2.5-21.9 |
*ovarian volume = 0.523 x length x width x depth (ml)
**> 80% ovaries seen over age 5 years2
Note
Cysts:
- greater than 80% of girls 1 day to 24 months.
- less than 70% of girls between 2 and 12 years.
- macrocysts (>9mm) may be seen in <20% of cystic ovaries.1
Small cysts are seen in more than 80% of patients older than 5 years of age (mean <7.5 mm).
Cysts were seen in 68% of premenarcheal 2 to 12 year olds, 90 -95% of which were < 9mm (mean 6 mm).
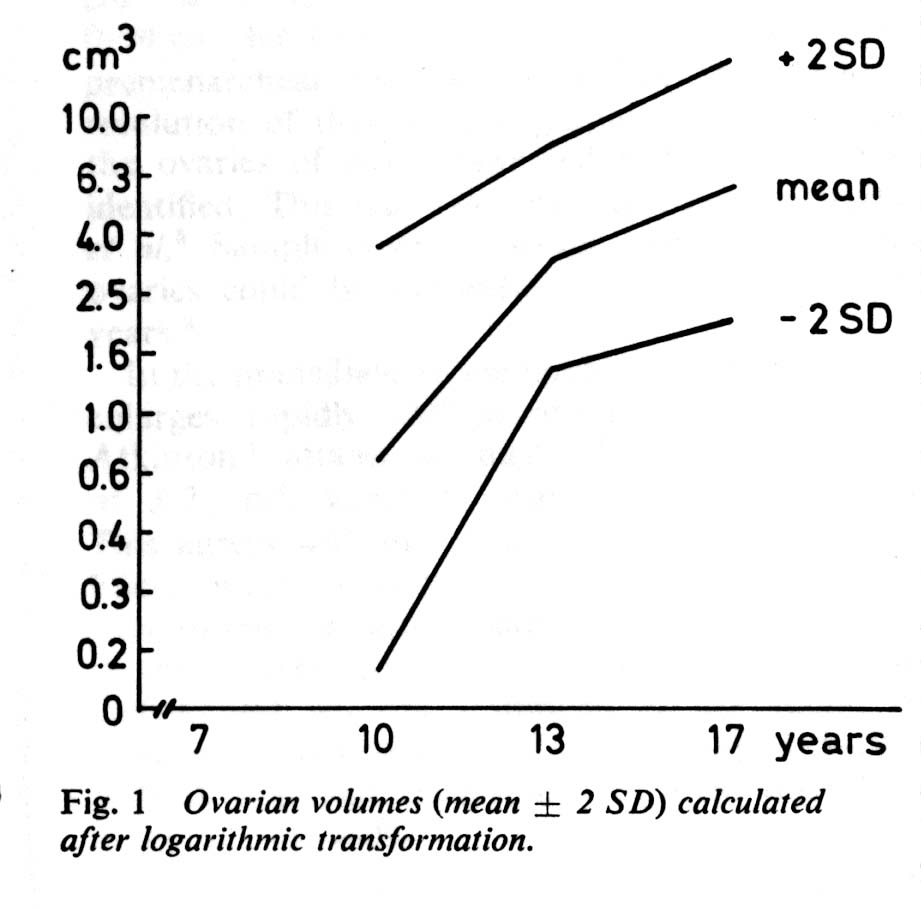
Ovarian Volume correlated with Age5
References:
- Cohen HL, Shapiro MA, Mandel FS, Shapiro ML. Normal ovaries in neonates and infants: a sonographic study of 77 patients 1 day to 24 months old. AJR 1993; 160: 583-586.
- Orsini LF, Salardi S, Pilu G, et al. Pelvic organs in premenarcheal girls: real-time ultrasonography. Radiology 1984; 153:113-116.
- Cohen HL, Tice HM, Mandel FS. Ovarian volumes measured by US: bigger than we think. Radiology 1990. 177:189-92.
- Siegel MJ. Pediatric Sonography. Raven Press: New York. 1995. pp 438
- Ivarsson S-A, Nilsson KO, Persson P-H. Ultrasonography of the pelvic organs in prepubertal and postpubertal girls. Arch Dis Child 1983, 58, 352-354 (Used with permission from BMJ Publishing Group)
Ovaries and uterus tanner score
Ovaries and uterus correlated with Tanner score¹
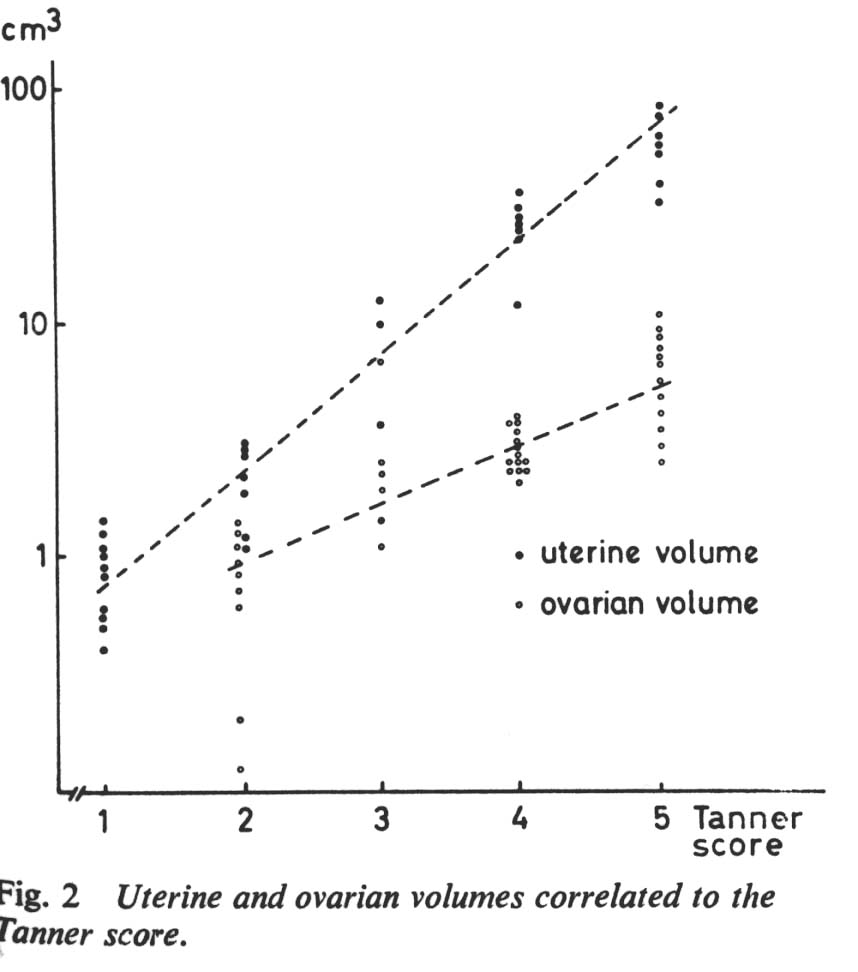
Lower curve = ovarian volume
References:
- Ivarsson S-A, Nilsson KO, Persson P-H. Ultrasonography of the pelvic organs in prepubertal and postpubertal girls. Arch Dis Child 1983, 58, 352-354 (Used with permission from BMJ Publishing Group)
Ovarian doppler
| Age | Type of flow/ menstrual phase | Arterial waveform pattern |
|---|---|---|
| pre- pubertal | low diastolic flow | low diastolic flow |
| post- pubertal* | follicular (0-7 days) | low to absent diastolic flow |
| follicular/ luteal (11-17 days) | increasing diastolic flow | |
| late luteal | decreasing diastolic flow |
*flow detectable in 90% of adolescents
*arterial flow can be detected occasionally in twisted adnexa
References:
- Siegel MJ. Pediatric Sonography 2nd Edition. Raven Press, New York 1995, p 440-441, 458.
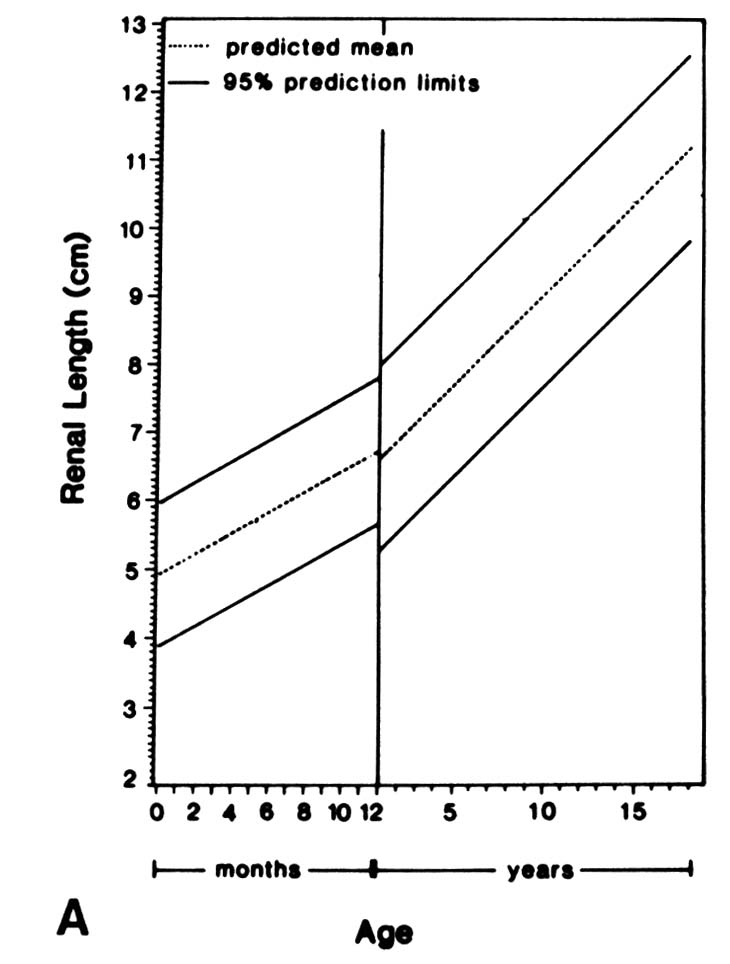
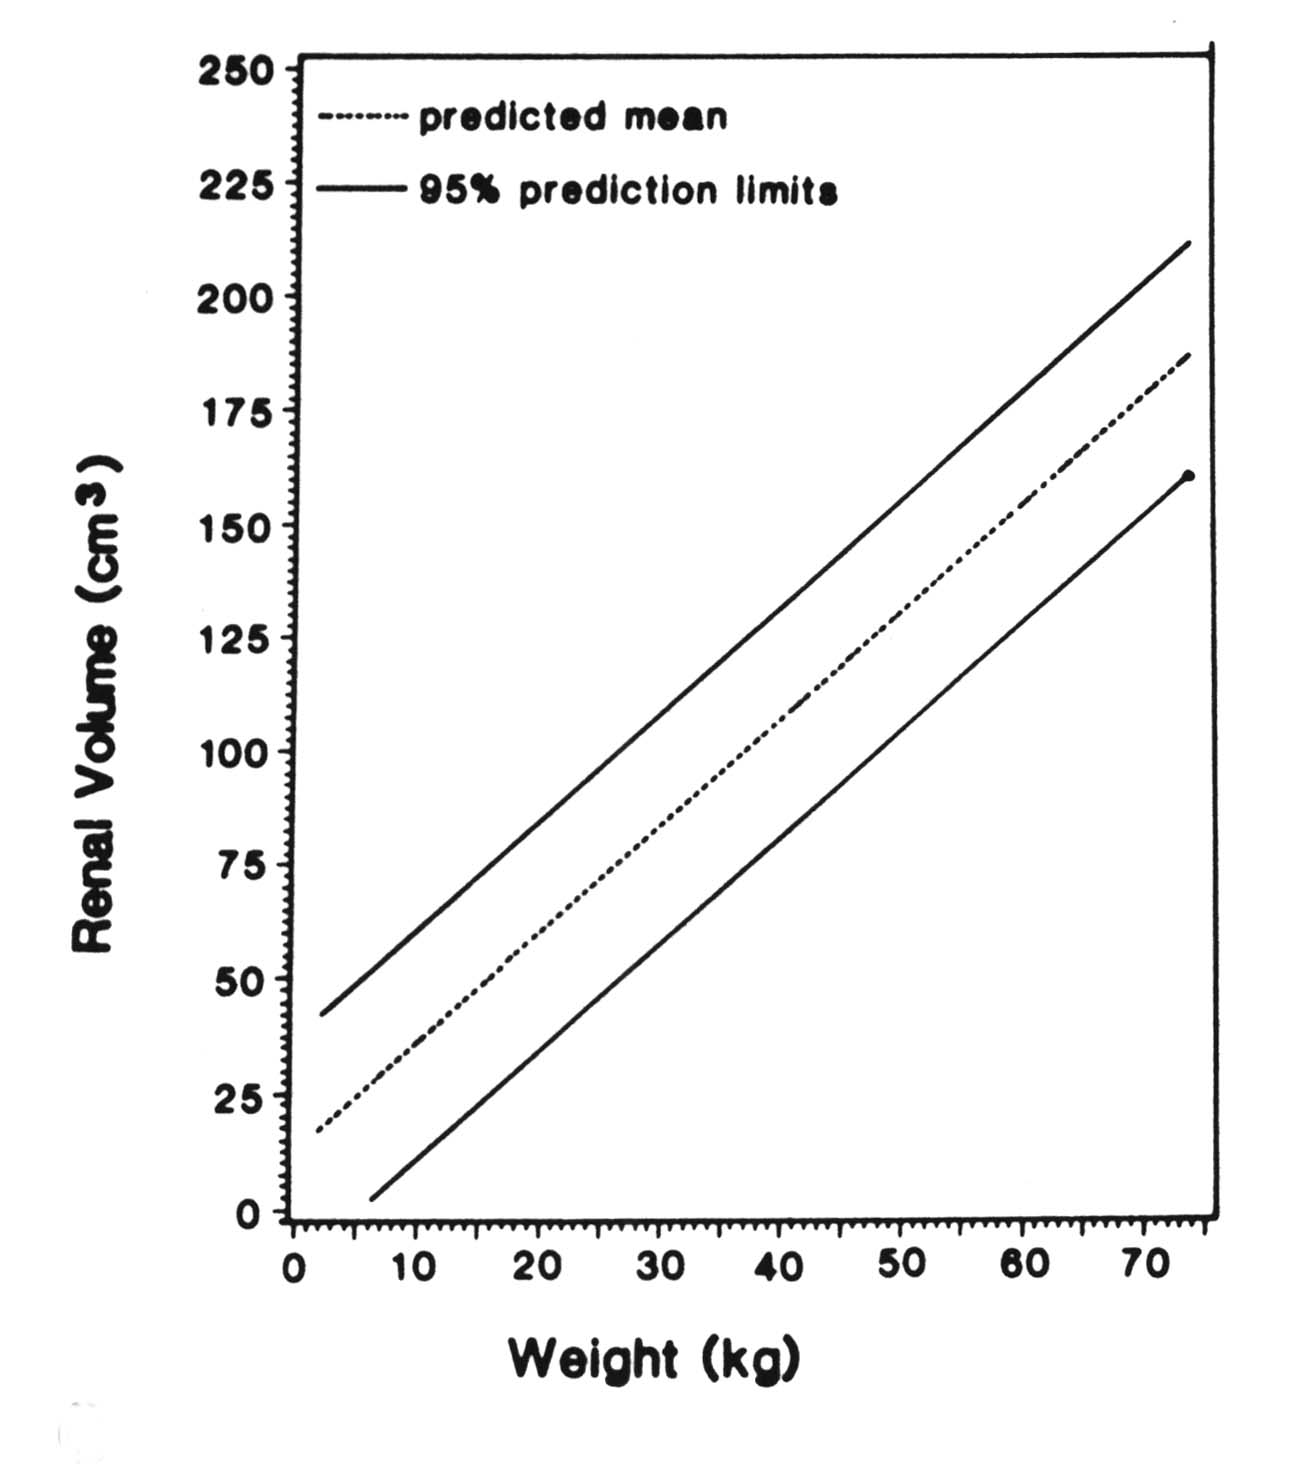
Renal ultrasound measurements
References:
- Han BK, Babcock DS. Sonographic measurements and appearance of normal kidneys in children. AJR 1985; 145(3):611-616. Tables used with permission.
Testcle
Normal size of the testicle as a function of age
| Age | Width (cm) | Length (cm) | Volume ± SE (cm3) |
|---|---|---|---|
| at Birth (ref#1,4) | 1.0 | 1.5 | 1.0 ± 0.14 |
| 1-3 months (ref#1,4) | 1.2 | 2.0 | 1.9 ± 0.11 |
| 4-6 months (ref#1) | 1.7 ± 0.11 | ||
| 1-10 years (ref#6) | 1.6 | 0.7 ± 0.9 | |
| 11-12 years (ref#6) | 1.7 increasing to 1.9 | 1.5 increase to 2.0 | |
| 13-16 years (ref#6) | 2.3 increasing to 3.5 | 5.0 increase to 13.0 | |
| Adult | 2-3 | 3-5 | 15-20 |
References:
- Cassorla Fg, Golden SM, Johnsonbaugh RD, et al. Testicular volume during early infancy. J Pediatrics 1981; 99:742-743.
- Daniel WA Jr, Feinstein RA, Howard-Peebles P, et al. Testicular volumes of adolescents. J Pediatrics 1982; 101:1010-1012.
- Krone KD, Carroll BA. Scrotal ultrasound. Radiol Clin North Am 1985; 23:121-139.
- Siegel MJ, Pediatric Sonography, 2nd Ed. 1995 Raven Press
- Atkinson GO, Patrick LE, Ball TI, et al. The normal and abnormal scrotum in children: evaluation with color doppler sonography. AJR 1992;158:613-617
- Kaplan SA. Clinical pediatric & adolescent endocrinology. W.B. Saunders. p. 307-308
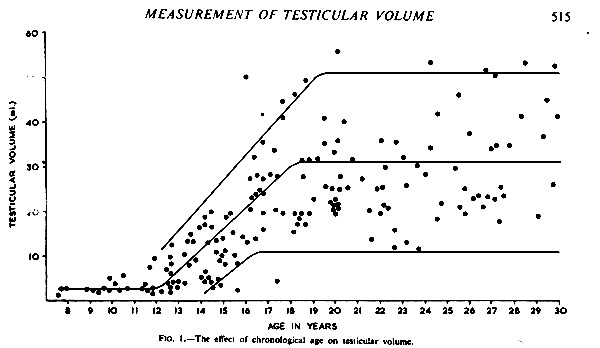
Testicular volume < 5 ml can be considered as infantile¹
Reference:
- Rundle AT, Sylvester PE. Measurement of Testicular Volume. It's application to assessment of maturation, and its use in diagnosis of hypogonadism. Arch Dis Child 37:514-517, 1962 (Permission requested from publisher: BMJ Publishing Group)
Testicle-Tanner score
Testicular Volume correlated with Tanner Score ¹
(based on external physical measurement of length and width)
| Tanner score | Left (cm³) | SD | Right (cm3) | SD |
|---|---|---|---|---|
| 1 | 4.76 | 2.76 | 5.2 | 3.86 |
| 2 | 6.4 | 3.16 | 7.08 | 3.89 |
| 3 | 14.58 | 6.54 | 14.77 | 6.1 |
| 4 | 19.8 | 6.17 | 20.45 | 6.79 |
| 5 | 28.31 | 8.52 | 30.25 | 9.64 |
References:
- Daniel WA, Feinstein RA, Howard-Peebles P, Baxley WD. Clinical and laboratory observations. Testicular volumes of adolescents. J Peds Dec 1982:1010-1012 (Modified: Permission requested from publisher)
Testicular doppler
Doppler flow in testes*¹
| Testicular volume | % detectable color flow |
|---|---|
| < 1 cc | 70 (capsular arteries) 40 (central arteries) |
| > 1 cc | +/- 100 (central & capsular) |
- * waveforms typically low resistance, high diastolic flow
- compare for symmetry
- lack of flow may be due to gain settings/high wall filter/high PRF etc²
References:
- Atkinson GO, Patrick LE, Ball TI, et al. The normal and abnormal scrotum in children: evaluation with color doppler sonography. AJR 1992;158:613-617
- Siegel MJ, Pediatric Sonography, 2nd Ed. 1995 Raven Press
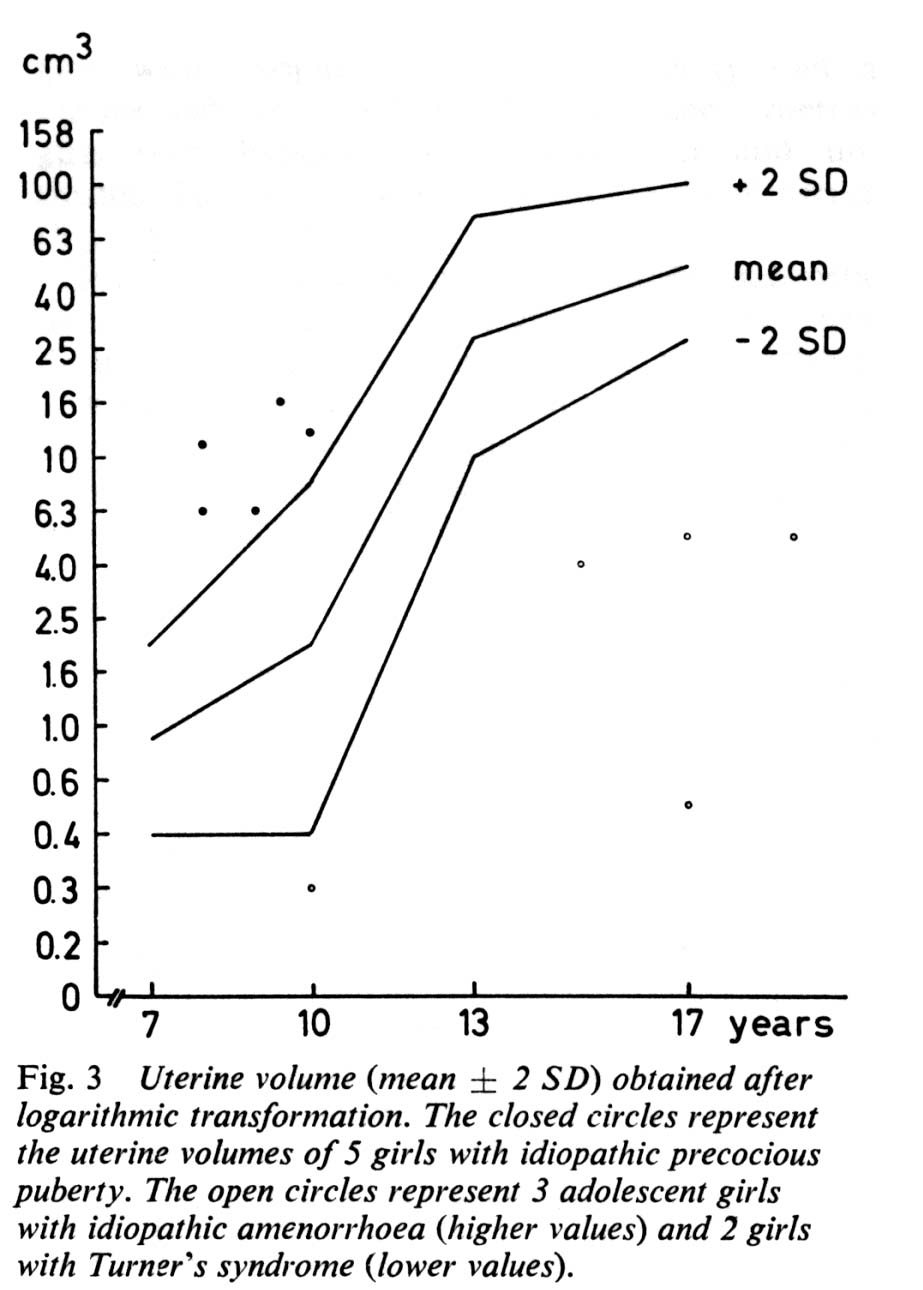
Uterus
Normal uterine appearance and dimensions
| Uterine stage | Gross features | Length (cm) | Fundal width of body (cm) | Cervical width (cm) |
|---|---|---|---|---|
| Neonatal*¹ | Cervix Fundus | 2.3-4.6 | 0.8-2.1 | 0.8-2.2 |
| Prepubertal+ 1-12 years³ | Fundus/ Body Cervix | 2.0-3.3 | 0.5-1.0 | |
| Postpubertal 13-20 years³ | Fundus > Cervix | 5-8 | 1.6-3.0 |
*neonatal uterus regresses to about 2.5 cm at 1 month1
+After 7 years of age, there is uterine growth4
Neonatal uterus: 30% of neonatal uteri have a hypoechoic halo surrounding the endometrial canal, which is thought to represent the inner third of the myometrium, which is vascularly engorged1.
References:
- Nussbaum AR, Sanders RC, Jones MD. Neonatal uterine morphology as seen on real-time US. Radiology 1986; 160: 641-643.
- Ivarsson SA, Nilsson KO, Persson PH. Ultrasonography of the pelvic organs in prepubertal and postpubertalgirls. Arch Dis Child. 1983; 58:352-354. (Used with permission from BMJ Publishing Group)
- Sample W, Lippe B, Gyepes M. Gray scale ultrasonography of the normal female pelvis. Radiology 1977; 125:477-483.
- Orsini LF, Salardi S, Pilu G, et al. Pelvic organs in premenarcheal girls: real-time ultrasonography. Radiology 1984; 153: 113-116.
Urinary bladder
Volume calculation: V = (H x W x D) X 0.625 mL¹ (H=height, W= width, D=depth)
Volume by age = (age in years + 2) x 30 mL
Bladder wall thickness*² *(ages 1 day to 19 years)
Site of measurement:
- Sagittal plane: posterior inferior wall (away from rectum)
- Transverse plane: lateral to trigone
| Degree of distention | Thickness (mm) | SD (mm) | Range (mm) |
|---|---|---|---|
| Full | 1.55 | 0.56 | 1-3 |
| Empty | 2.76 | 0.58 | 2-4.5 |
References:
- Haken berg OW, Ryall RL, Langlois SL, et al: The estimation of bladder volume by sonocystography. J Urol 1983; 130:249-251
- Jequier S, Rousseau O. Sonographic measurements of the normal bladder wall in children. AJR 149:563-566, Sep 1987
Musculoskeletal
Antevesion
Normal anteversion of the femoral neck (radiography)1,2
| Age (years) | Anteversion |
|---|---|
| Birth - 1 | 30° - 50° |
| 2 | 30° |
| 3-5 | 25° |
| 6-12 | 20° |
| 12-15 | 17° |
| 16-20 | 11° |
| 20 | 8° |
Normal Femoral Neck Torsion angle (Computed Tomography)3
(see reference for method)
| Age | Anteversion angle |
|---|---|
| Birth | +34° to +40° |
| Adult | +10° to +15° |
Reference:
- Billing L: Acta Radiol 1954; Suppl 110. Averages adapted from several investigators.
- Keats TE Atlas of Roentgenographic Measurement. Mosby Year Book: St. Louis. 1990. p. 330.
- Mesgarzadeh, M, Revesz G, Bonakdarpour K. Femoral neck torsion angle measurement by computed tomography. Journal of Computed Tomography 11(5):799-803. September/October 1987
Hindfoot and forefoot
Normal angular relationships of the hindfoot and forefoot
| view | Angle | Newborn | 2 years | 4 years | Birth to 9 |
|---|---|---|---|---|---|
| AP | Talocalcaneal | 42° (27°-56°) | 40° (26°-50°) | 34° (24°-44°) | 15°-56° |
| AP | Calcaneal-fifth metatarsal | 3° | 0° | -1° | -10° to 14° |
| AP | Talar-first metatarsal | 20° | 13° | 10° | -9° to 31° |
| Lateral | Talocalcaneal | 39° (23°-55°) | 41° (27°-56°) | 44° (31°-57°) | 23° to 56° |
| Lateral | Talocalcaneal w/ maximum dorsiflexion | 45° (35°-56°) | 44° (33°-54°) | 33° (32°-52°) | 25° to 55° |
| Lateral | Tibiocalcaneal | 77° | 71° | 67° | 56° to 95° |
| Lateral | Tibiocalcaneal w/ maximum dorsiflexion | 42° | 46° | 50° | 25° to 73° |
| Lateral | Tibiotalar | 115° | 114° | 113° | 86° to 145° |
| Lateral | Talar-first metatarsal | 19° | 21° | 9° | -7° to 39° |
| Lateral | Talar- horizontal | 34° | 31° | 30° | 14° to 55° |
| Talocalcaneal index | 76° | 76° | 76° | 45° to 103° |
References:
- Vanderwilde R, Staheli LT, Chew DE, Malagon V: Measurements on radiographs of the foot in normal infants and children. J Bone Joint Surg 70A:407, 1988. Modified by from Ozonoff MB.
- Pediatric Orthopedic Radiology. W.B. Saunders Company: Philadelphia. 1992. (Used with permission from M.B. Ozonoff; publisher's permission requested)
Hip
Jump down under Hip to:
US hip types
Medial joint space
Center edge angle
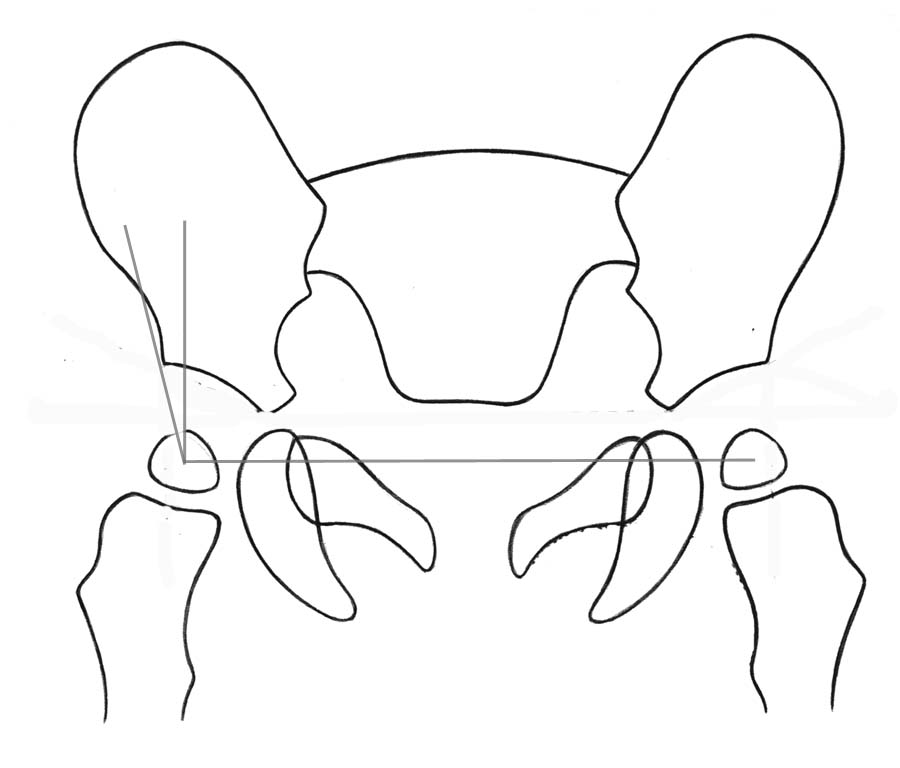
Normal acetabular angles*1
| Age | Acetabular angle --female (degrees) | Acetabular angle --male (degrees) |
|---|---|---|
| Newborn | 28.8 ± 4.8 | 26.4 ± 4.4 |
| 3 Month Old | 25 ± 3.5 | 22 ± 4 |
| 6 Month Old | 23.2 ± 4.0 | 20.3 ± 3.7 |
| 1 Year Old | 21.2 ± 3.8 | 19.8 ± 3.6 |
| 2 Year Old | 18 ± 4 | 19 ± 3.6 |
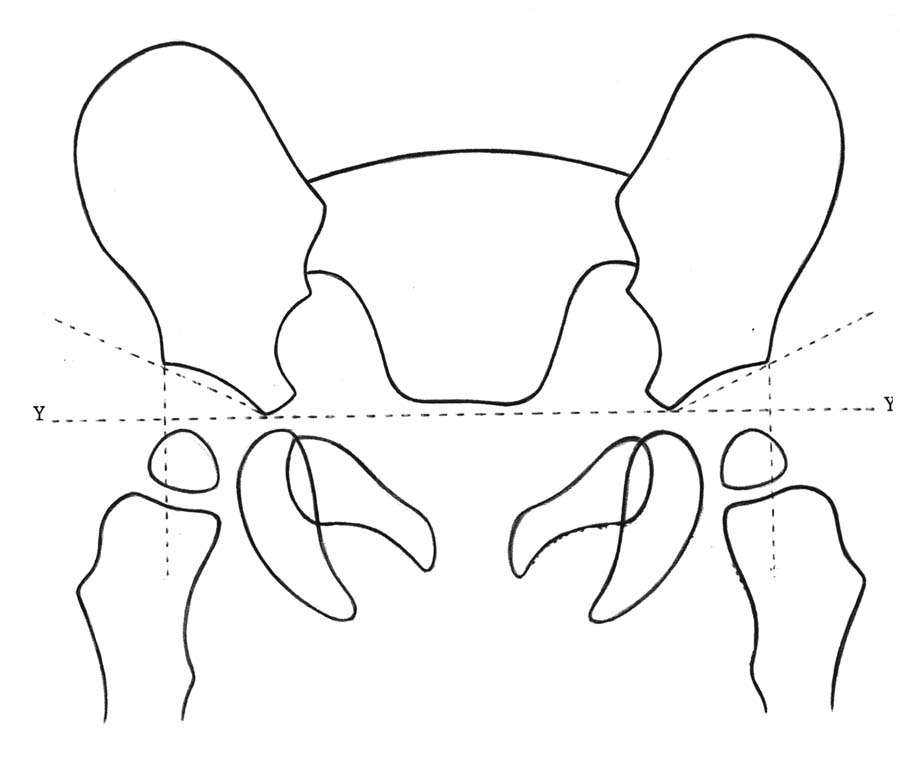
*Acetabular angle defined as the angle made from line through the Y synchondroses and another line through the superior and inferior points of the iliac portion of the acetabulum.
Reference:
- Caffey in Ozonoff MB. Pediatric Orthopedic Radiology. W.B. Saunders Company: Philadelphia. 1992. p181. (Used with permission from M.B. Ozonoff; publisher's permission requested)
Normal sonographic appearance of infant hip
| Sonographic hip type | Alpha angle* |
|---|---|
| 1 Normal | > 60° |
| 2A Physiologic Immaturity < 3 months old | 50° - 59° |
| 2B Delayed ossification > 3 months old | 50° - 59° |

Reference:
- Modified from Graf R, Schuler P. in Sonography of the infant hip: an atlas. Weinheim: VCH Verlagsgesellschaft, 1986 and Schlesinger AE, Hernandez RJ. Diseases of the musculoskeletal system in children: imaging with CT, sonography, and MR. AJR 1992; 158: 729-741.
Medial joint space
The medial joint space is used to determine lateral displacement of the femoral head. It is defined as the distance measured from the medial edge of the femoral ossific nucleus (where it is broadest just above the growth plate) to the adjacent acetabular wall. When the ossific nucleus is absent or asymmetric, measurement is made from the femoral neck metaphysis just below the growth plate. This measurement is best made on the frog-lateral projection.
Normal range: 6 months to 11 years = 5-12 mm. From side to side, the medial joint space of both hips should be within 1.5 mm of each other.
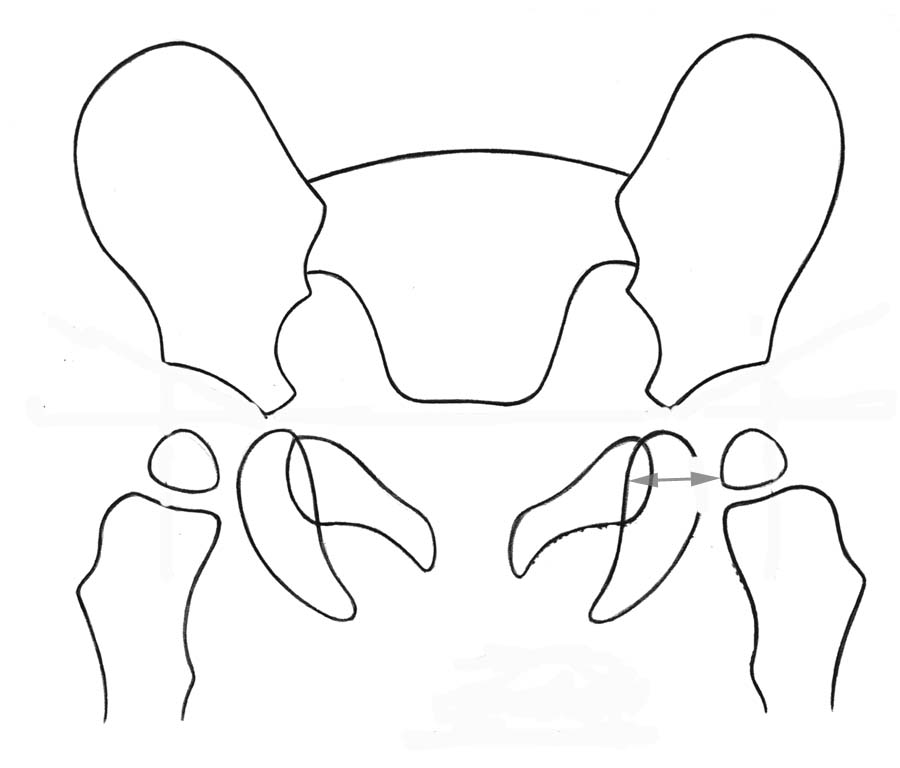
Medial joint space = distance from widest portion of femoral head to adjacent acetabulum
Reference:
- Eyring et al., 1965 in reference: Ozonoff MB. Pediatric Orthopedic Radiology. W.B. Saunders Company: Philadelphia. 1992. p181. (Used with permission from M.B. Ozonoff; publisher's permission requested)
Center-edge angle (Wiberg)
The center edge angle is used to evaluate the relationship of the femoral head to the acetabulum. It is defined as the angle formed by a line drawn through the center of the femoral head and the edge of the acetabulum and another line perpendicular to a line drawn through the center of the femoral heads. The value of this is limited if the femoral head is deformed or if the ossific center is small or eccentric.
Normal center-edge angles
| Age | Center edge angle (°) |
|---|---|
| 3 months | 18° - 20° |
| 2 years | 30° |
| lowest limit of normal, age 5 to 8 years | 19° |
| lowest limit of normal, age 9 to 12 y | 25° |
| lowest limit of normal, age 13 to 20 y | 26° - 30° |
Reference:
- Ozonoff MB. Pediatric Orthopedic Radiology. W.B. Saunders Company: Philadelphia. 1992. p181. (Used with permission from M.B. Ozonoff; publisher's permission requested)
Kyphosis and lordosis
Standing lateral radiograph normal angles for
Thoracic Kyphosis:
- Normal Angle - 21° to 33º
- measured from T3 to T12
- Thoracic kyphosis is usually measured using the superior end plate of T3 and the inferior end plate of T12.
Lumbar Lordosis:
- Normal Angle 31 to 50º
- measured from L1 to L5
- Lumbar lordosis is measured using the superior end plate of L1 and the inferior end plate of L5
Reference:
- Ozonoff MB. Pediatric Orthopedic Radiology. W.B. Saunders Company: Philadelphia. 1992. p. 68.
Metaphyseal- diaphyseal angle
Measurement of the metaphyseal- diaphyseal angle for differentiation between physiologic bowing and tibia vara
| Age (months) | Metaphyseal- diaphyseal angle (°) - average (range) | |
|---|---|---|
| Physiologic bowing | 11 - 20 | 5.1 ± 2.8 (0 -11) |
| Physiologic bowing | 21 - 30 | 5.1 ± 2.8 (0 -11) |
| Tibia vara | 11 - 20 | 5.1 ± 2.8 (0 -11) |
| Tibia vara | 11 - 20 | 5.1 ± 2.8 (0 -11) |
Reference:
- Keats TE Atlas of Roentgenographic Measurement. Mosby Year Book: St. Louis. 1990. p. 314..
Tibial torsion angle (Computed Tomography)
(see reference for method)
External torsion of malleolar plane relative to proximal tibial condyles
+25 to +55 degrees
Reference:
- Laasonen EM, Jokio P, Lindholm TS. Tibial Torsion measured by computed tomography. Acta Radiologica Diagnosis 25 (1984) Fasc 4. 325-329
Neuroradiology
Neonatal brain
Sonographic normal cerebral ventricle measurements by age
| Age | Frontal horn (mm) | Body (mm) | Third ventricle (mm) |
|---|---|---|---|
| Premature infant | < 10* | ||
| Term infant | 10-11* | ||
| Newborn | ≤ 3 | < 4 |
*Body - Measured in a transaxial view from its lateral edge to the midline. (This is not truly the width of the lateral ventricle but the distance from the superolateral ventricular wall to the falx).
Reference:
- Goldberg BB, Kurtz AB. Atlas of Ultrasound Measurements. Mosby Year Book: Chicago. 1990. pp. 20-22.
Sinuses
Visualization of the paranasal sinuses*
- Maxillary - 2 to 3 months
- Ethmoidal - 3 to 6 months
- Sphenoidal - 1 to 2 years
- Frontal - 8 to 10 years
* The radiographic visualization of the sinuses lags the actual gross appearance based on autopsy.
Reference:
- Kirks DR. Griscom NT. Practical Pediatric Imaging. Lippincott - Raven: Philadelphia. 1998.