Data and Marginalized Populations
Institutional Data
In the late nineteenth century, Oregon’s health institutions grew to support the increasing population of the new state. Health professionals who worked in such institutions could observe a larger number of patients, and use data and statistics to communicate their findings and the progress of their institution.
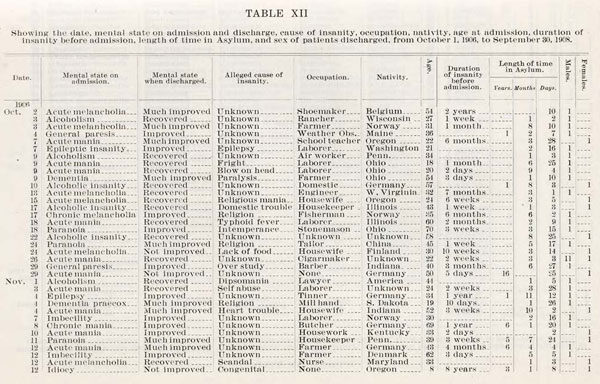
In its biennial reports, the Oregon State Insane Asylum published patient data, including alleged cause of mental illness, marital status, birth place, age at admission, and time in the asylum.
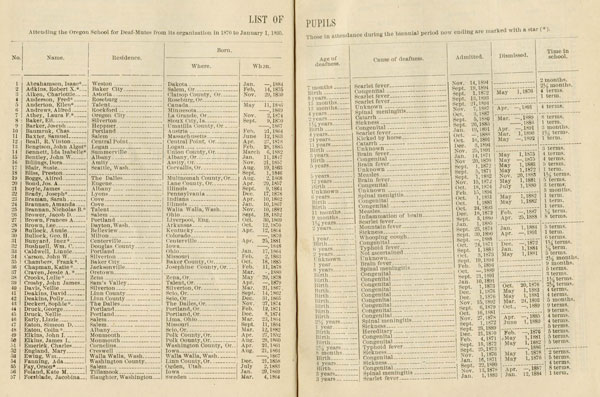
Oregon School for the Education of Deaf Mutes’ 1895 biennial report contains a wealth of tabulated data about the institution and its students, including the causes of deafness for students enrolled at the school between 1870 and 1895.
Marginalized Populations
Data may be scientific, but it is not neutral. Those who collect data determine what kind of information to collect, how to collect it, and who to collect it from.
Today, many researchers who use data are interested in groups that were historically marginalized, such as women, minorities, people of color, people with disabilities, and LGBTQ communities. These communities left fewer written records for researchers to consult, due to their position in society. This makes their histories more difficult to research using traditional methods. Persistent researchers can find some of these stories hidden in archival data.
However, historical research on marginalized groups is often hindered by the limitations of available data. Data about these groups was often collected using biased, unclear, or inconsistent methods – or simply omitted because it was not considered important.
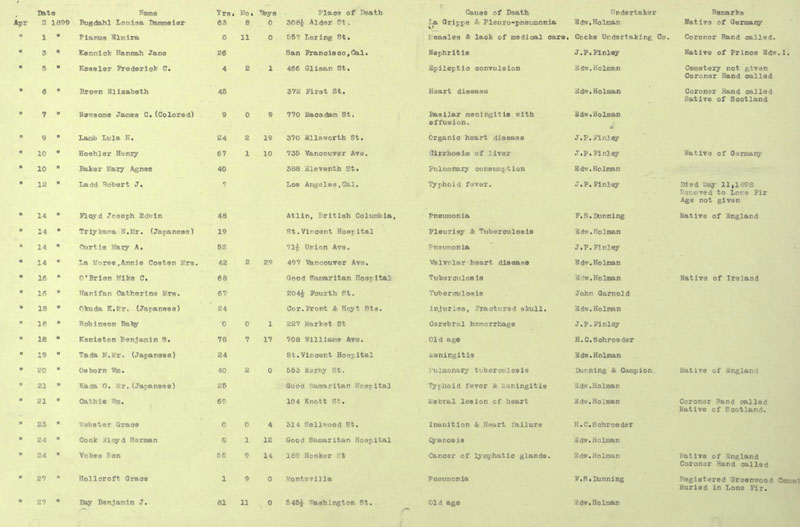
In the collection of 1891-1901, records of deaths in the Portland area, information about ethnicity is collected inconsistently. Sometimes, but not always, the individual’s ethnicity was noted alongside other data.Even when ethnicity was noted, the terminology was inconsistent, and does not map to today’s understandings of race and ethnicity. This data probably served its original purposes well; however, it would be challenging for a researcher today to use this data alone to decisively answer questions about ethnic populations in turn-of-the-century Portland.
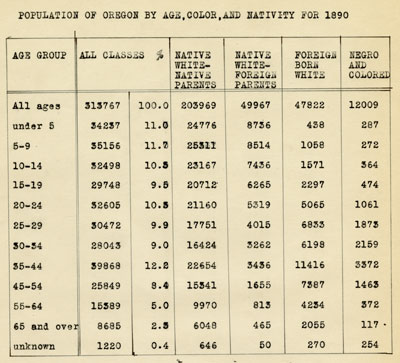
In a public health survey of the city of Portland, prepared by University of Oregon Medical School students in 1934, the population of the city is represented in a table broken out by age, nativity, and race. The structure of the table indicates that information about nativity of the white population was scrutinized more closely than information about race. The white population is represented in three separate columns: whites born in the United States whose parents were born in the United States, whites born in the United States whose parents were born in foreign countries, and whites born in foreign countries. The rest of the population is represented in a single column labeled "Negro and Colored." The data in the table may be more useful as an insight into how race and class were understood in 1934, than as an indication of the racial demographics of Portland.
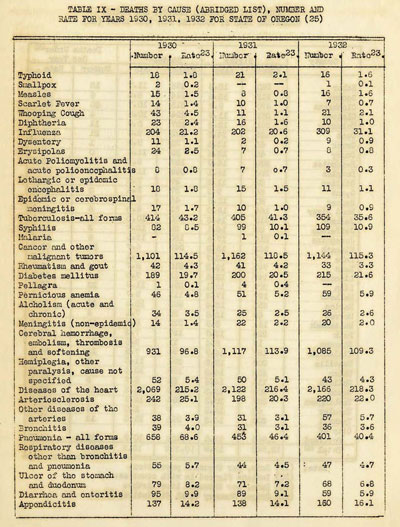
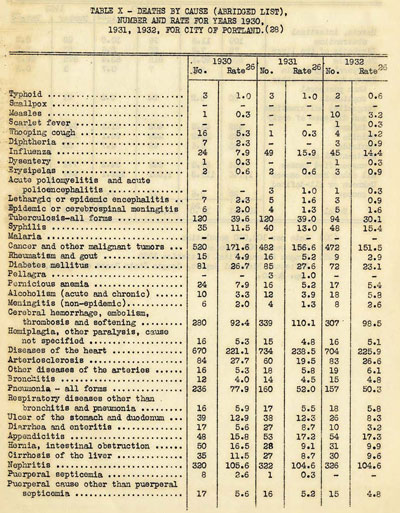
In Oregon, rural residents can also constitute marginalized populations in public health surveys. Though the state measures more than 98,000 square miles in size, some supposedly statewide surveys focused primarily on Portland. During his 1934 survey for the Oregon Legislature, Joseph Mountin, M.D. visited only twenty of Oregon’s thirty-six counties and used observations from those local health jurisdictions to draw conclusions about the entire state. This decision neglected the majority of central Oregon and a significant portion of the Willamette Valley. It might be understood why Dr. Mountin chose not to visit Lake and Harney Counties, the least densely populated counties in Oregon at the time. However, he also decided to not survey Washington County, then the third most densely populated county in the state. Further emphasizing the tendency of public health surveys to concentrate on Portland, Dr. Mountin’s survey included two tables with data pertaining to the leading causes of death: one for the entire state and one for Portland alone.
When data is inconsistent or missing, researchers can still make inferences by interpreting historical terminology and methods, comparing the data to more reliable sources, or combining multiple sources of data. The bias revealed in historical data can also be revealing, in and of itself.